.png)


Increase in coverage problems as days get longer and warmer, since more time is spent in gardens or on balconies. A suspicious drop in data usage right when schools start.
A rise in congestion during the holiday season, when everyone gathers with their loved ones under the same roof. Seasonal impact on Wi-Fi performance is predictable—expected, even. The kind of pattern that shows up every year like clockwork… and gets lovingly tracked by Wi-Fi nerds like us.
But then there’s one day that refuses to play by the seasonal rules.
One day, when Wi-Fi behaviour goes completely off-script, regardless of country or season: New Year’s Eve. Whether it’s a cosy night at home or a full-on night out, something shifts in Wi-Fi usage behaviour on New Year’s Eve. So put on your detective hat and grab your magnifying glass—here are the New Year’s Eve trends observed in Wi-Fi usage, and what can be Sherlocked about user behaviour from them.
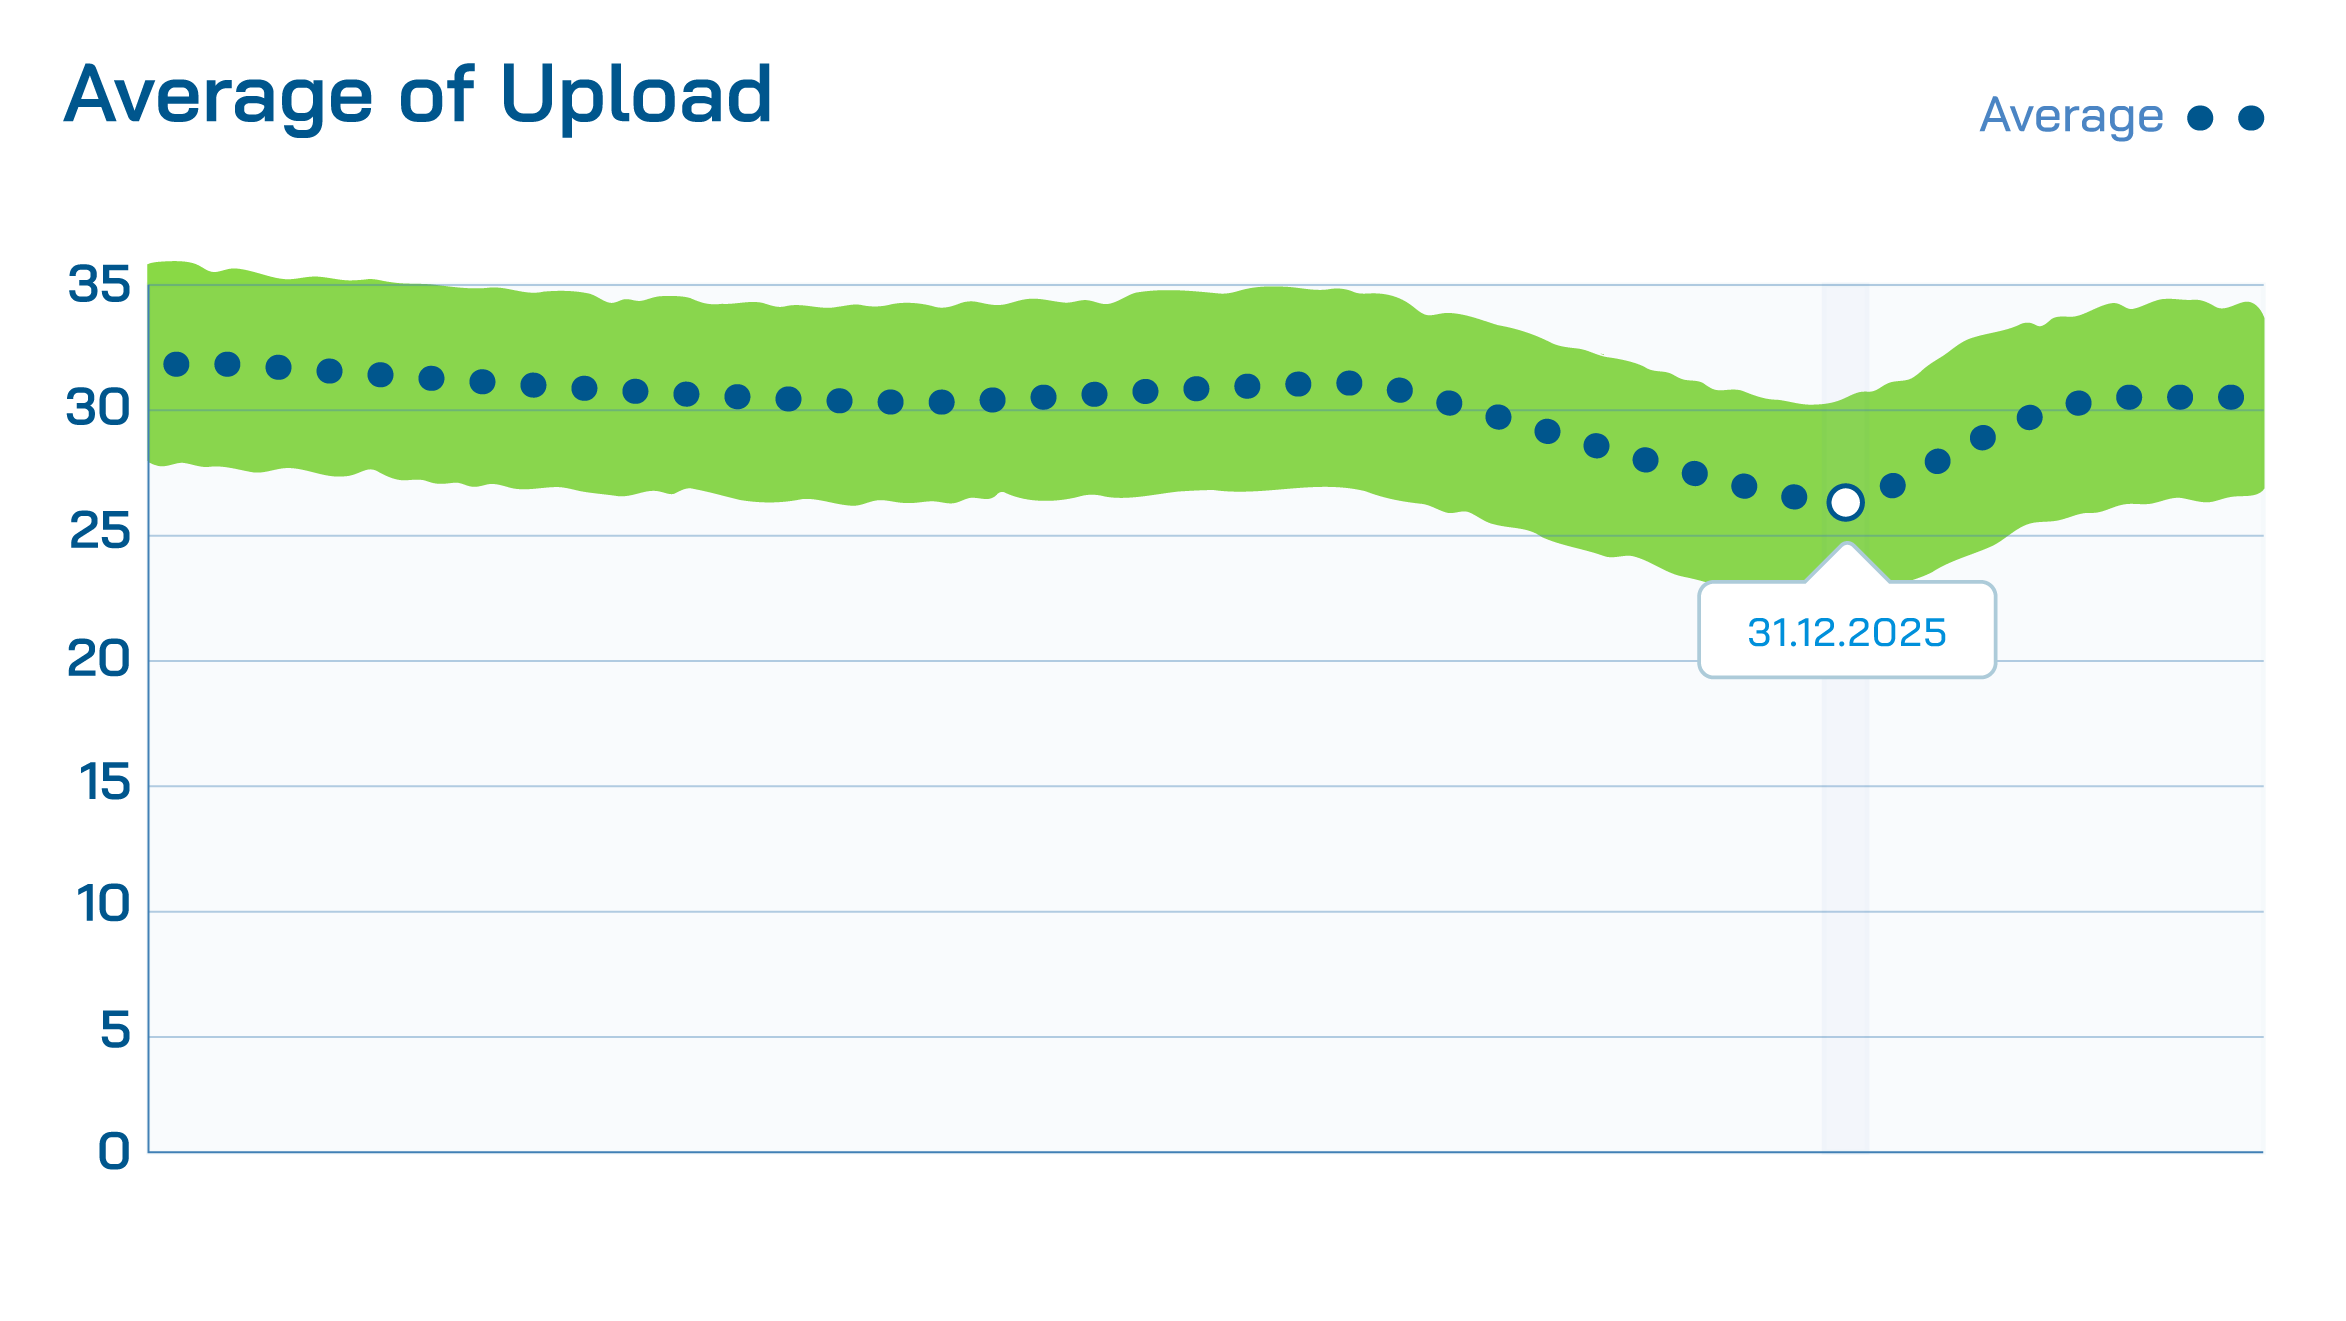
Uploaded data (in GB) decreased by approximately 10% around New Year’s Eve, reaching its lowest point on December 31st.
This may indicate that users spent less time on data-heavy upload activities such as live streaming, video calls, or large file sharing during New Year’s Eve. Hopefully, many of them were truly off work and enjoying the celebrations—rather than uploading files and sitting in meetings.
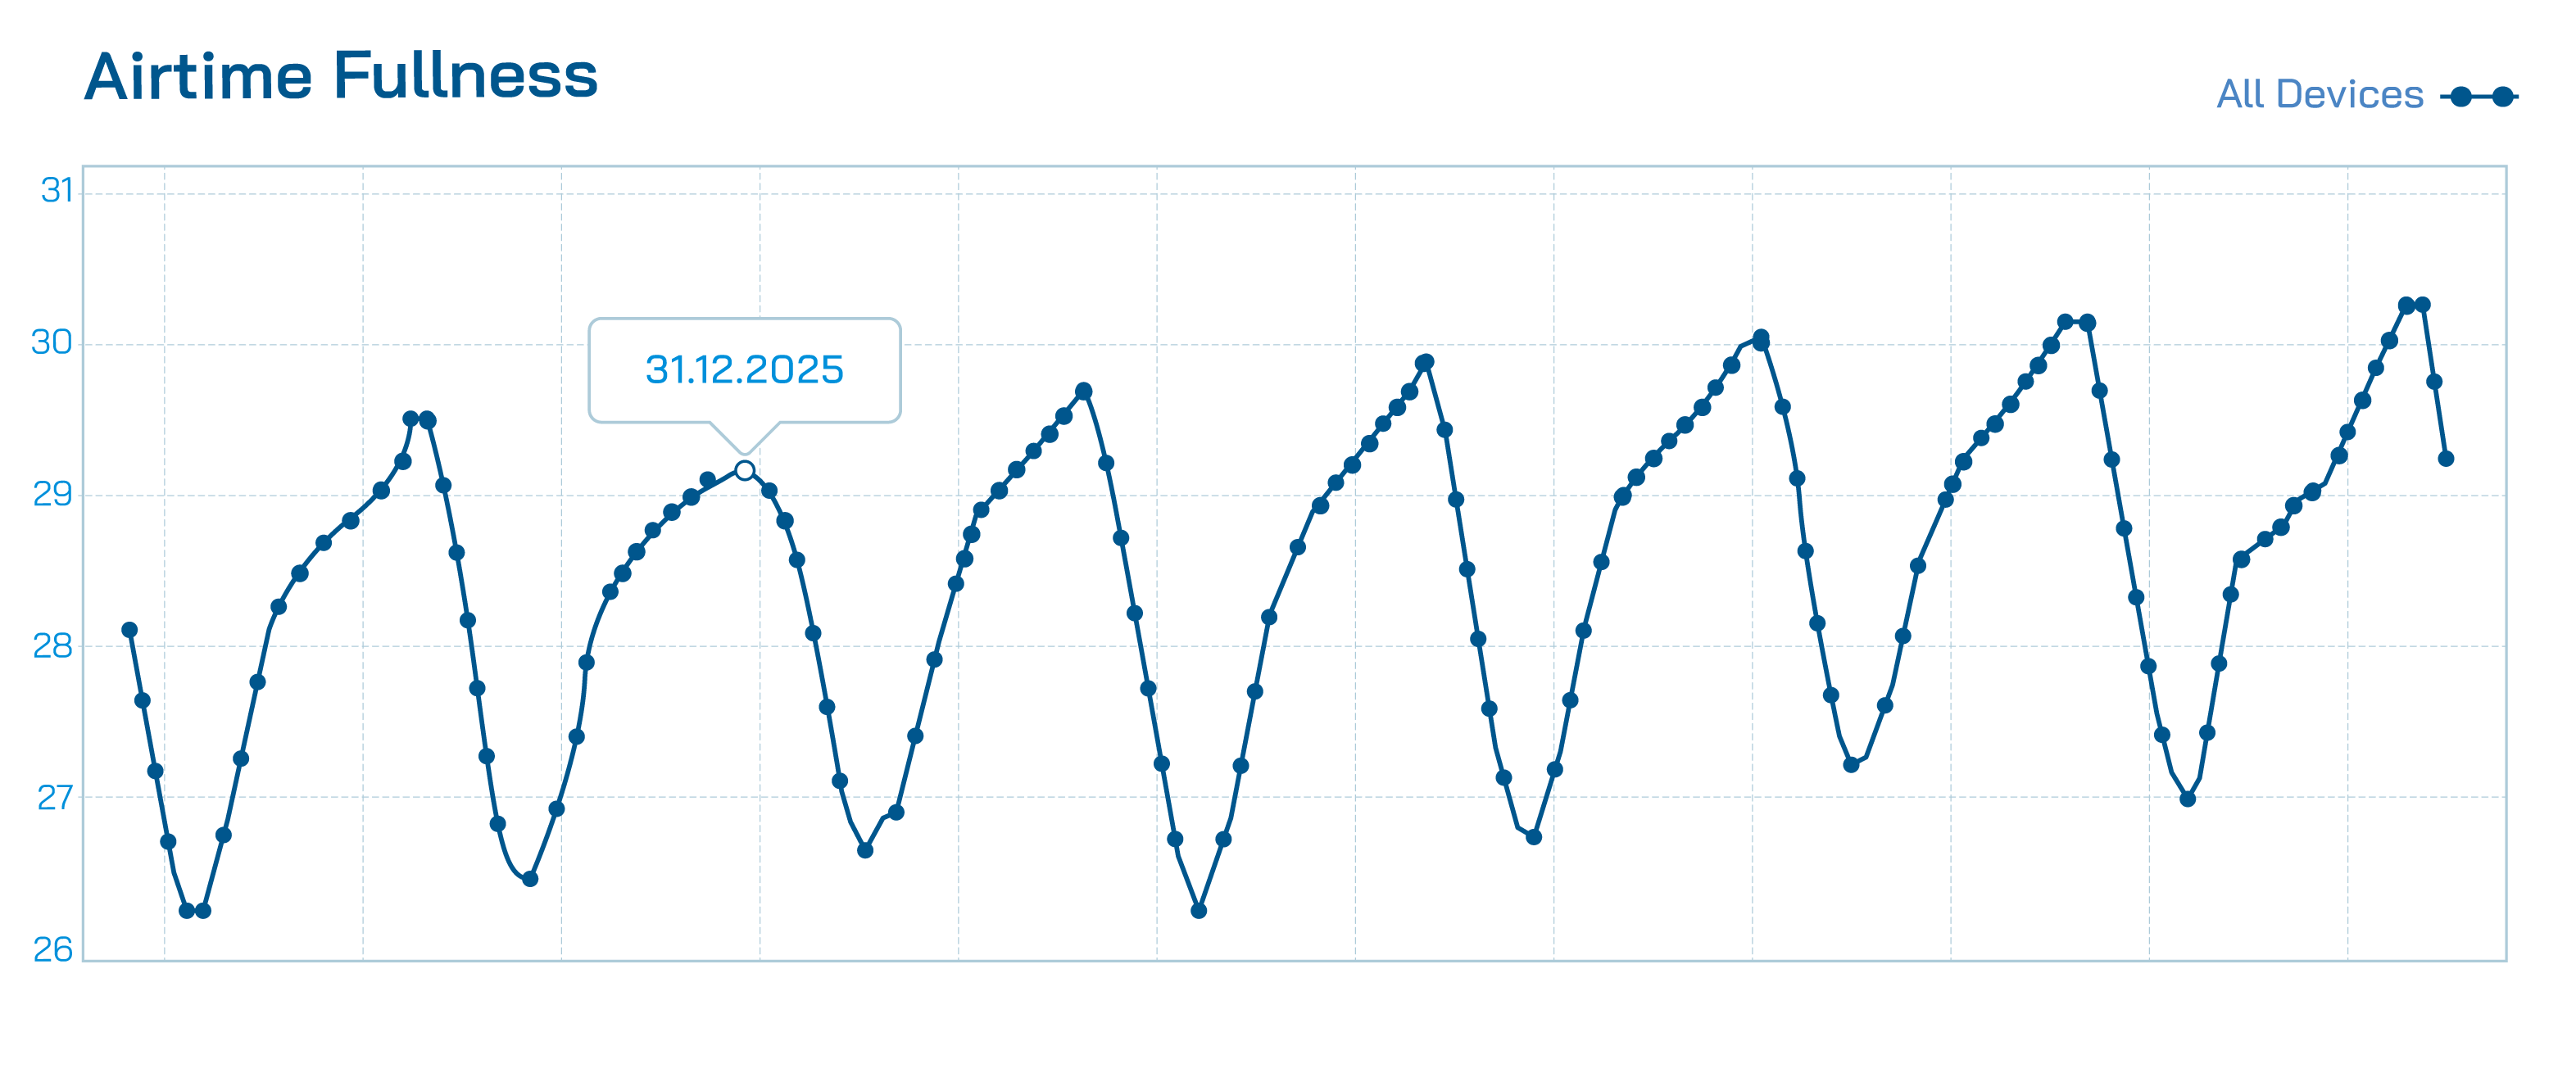
Airtime fullness in home networks on 5 GHz typically peaks around 8–9 PM. Not on New Year’s Eve, though! We observed that airtime fullness didn’t follow its usual pattern and instead stayed relatively stable between 7–10 PM.
What’s interesting is that we didn’t see the same level of change on 2.4 GHz.
This likely reflects lower Wi-Fi activity from devices that primarily use 5 GHz, such as laptops and smartphones—matching the overall drop in data-heavy usage.
Meanwhile, the smaller change in 2.4 GHz airtime fullness may suggest that devices that rely heavily on 2.4 GHz—like IoT devices—stayed connected and active as usual.
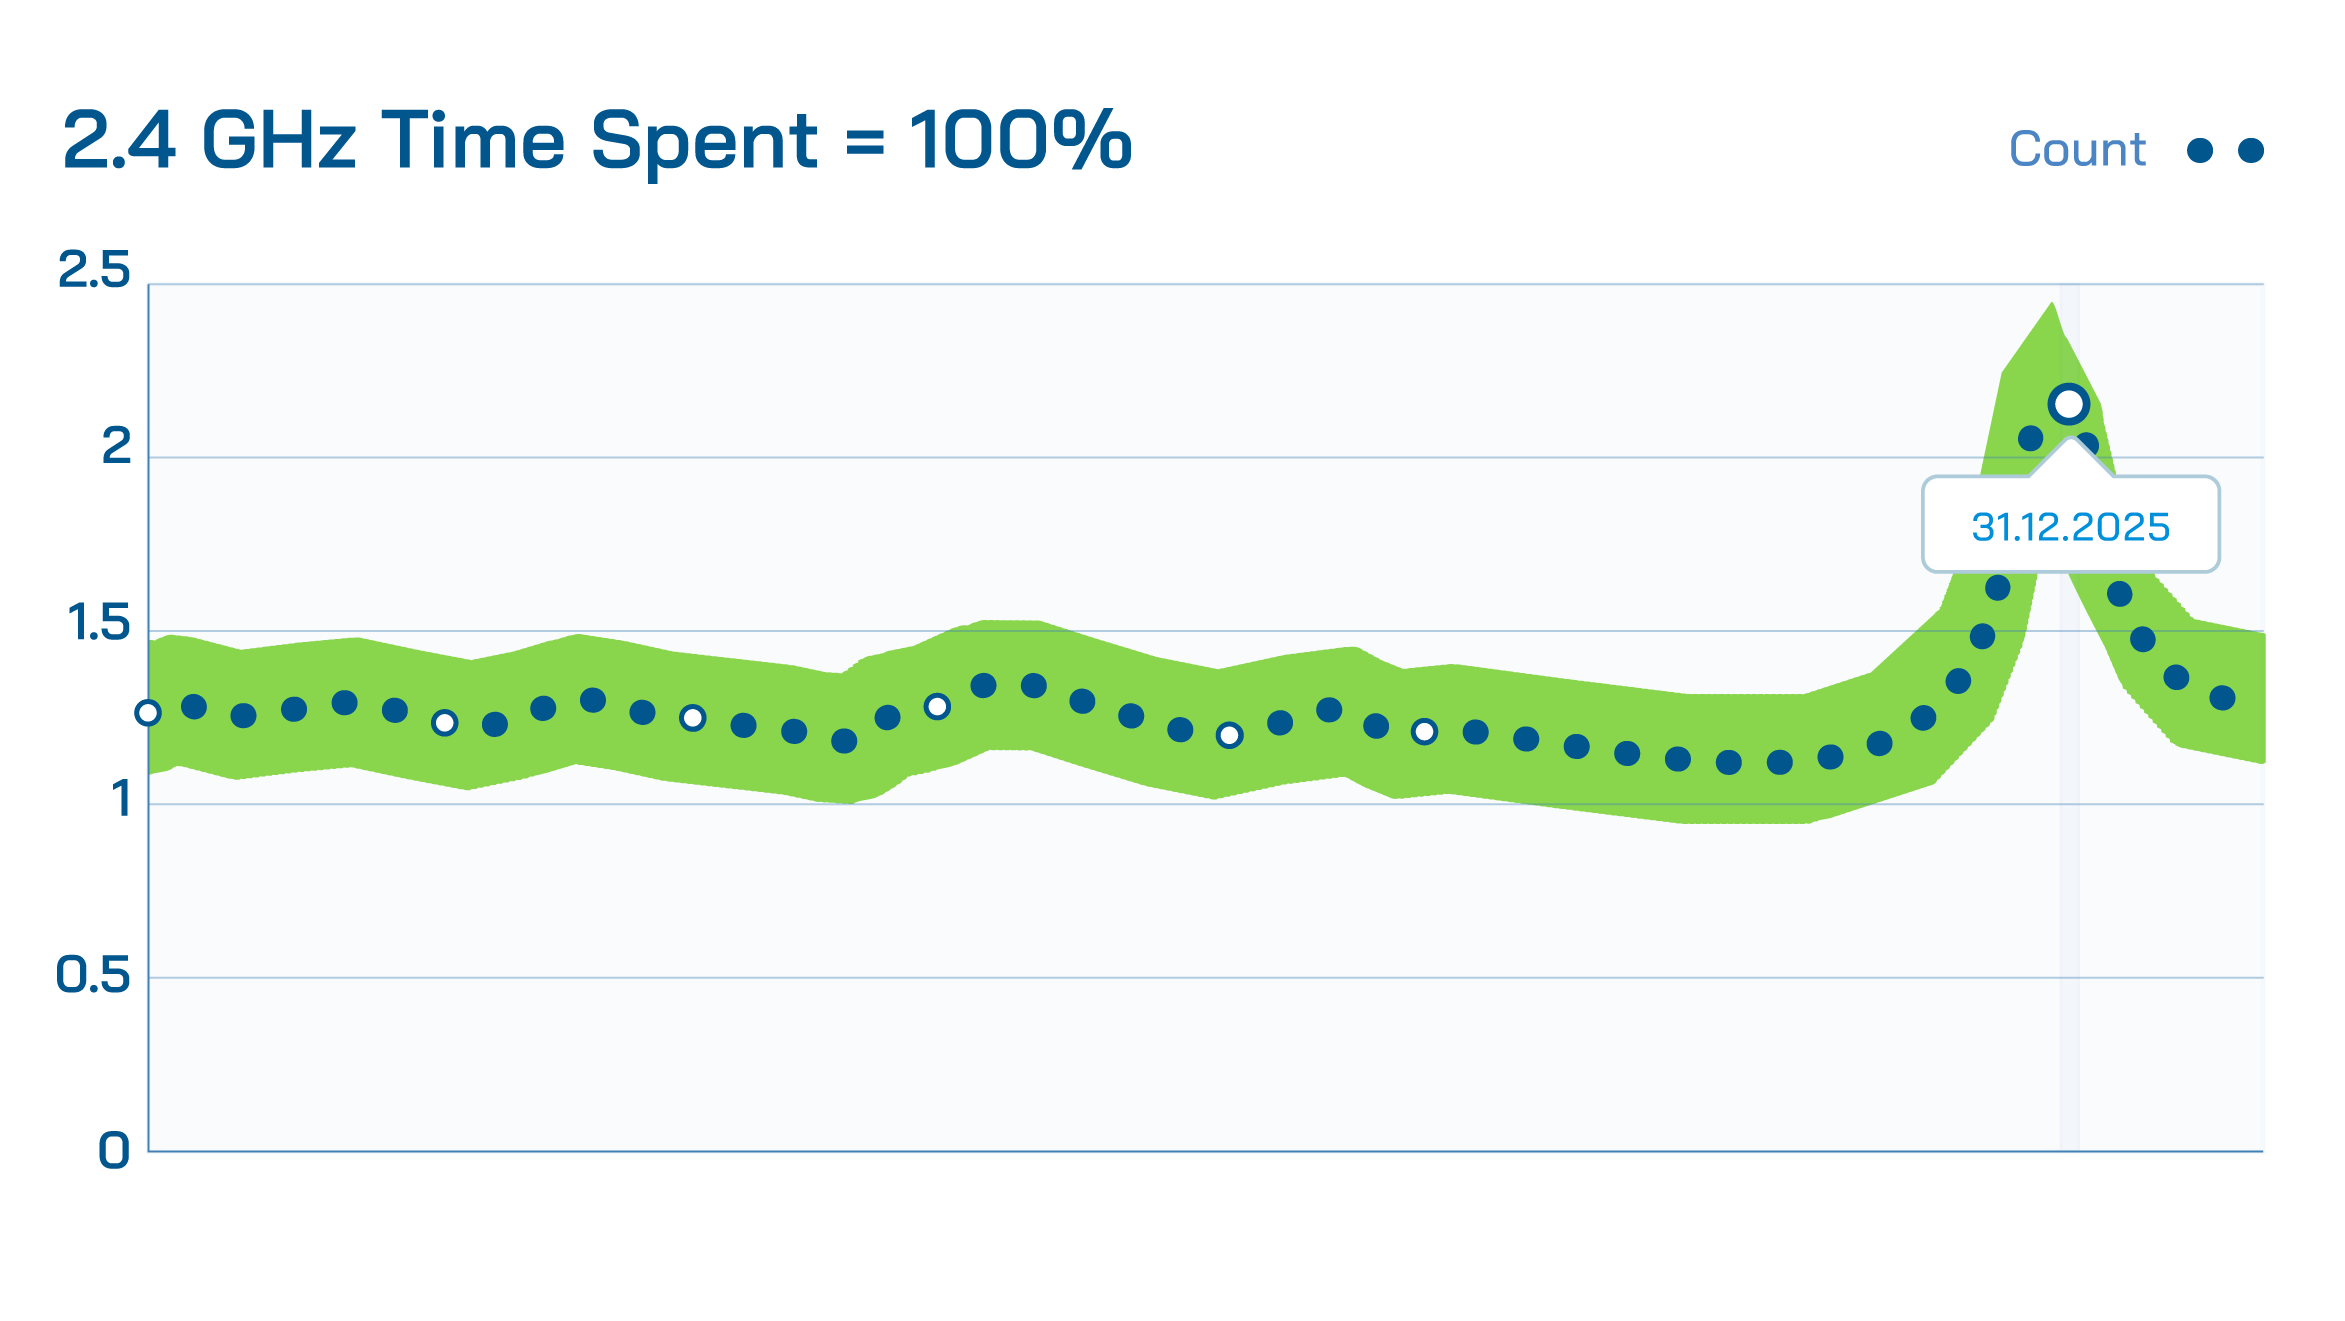
The number of homes that spend all their time on 2.4 GHz—despite using a single SSID—increased by 50% around New Year’s Eve.
It looks like some users simply weren’t home, and their Wi-Fi usage was dominated by the true loyal residents of the house: IoT devices.
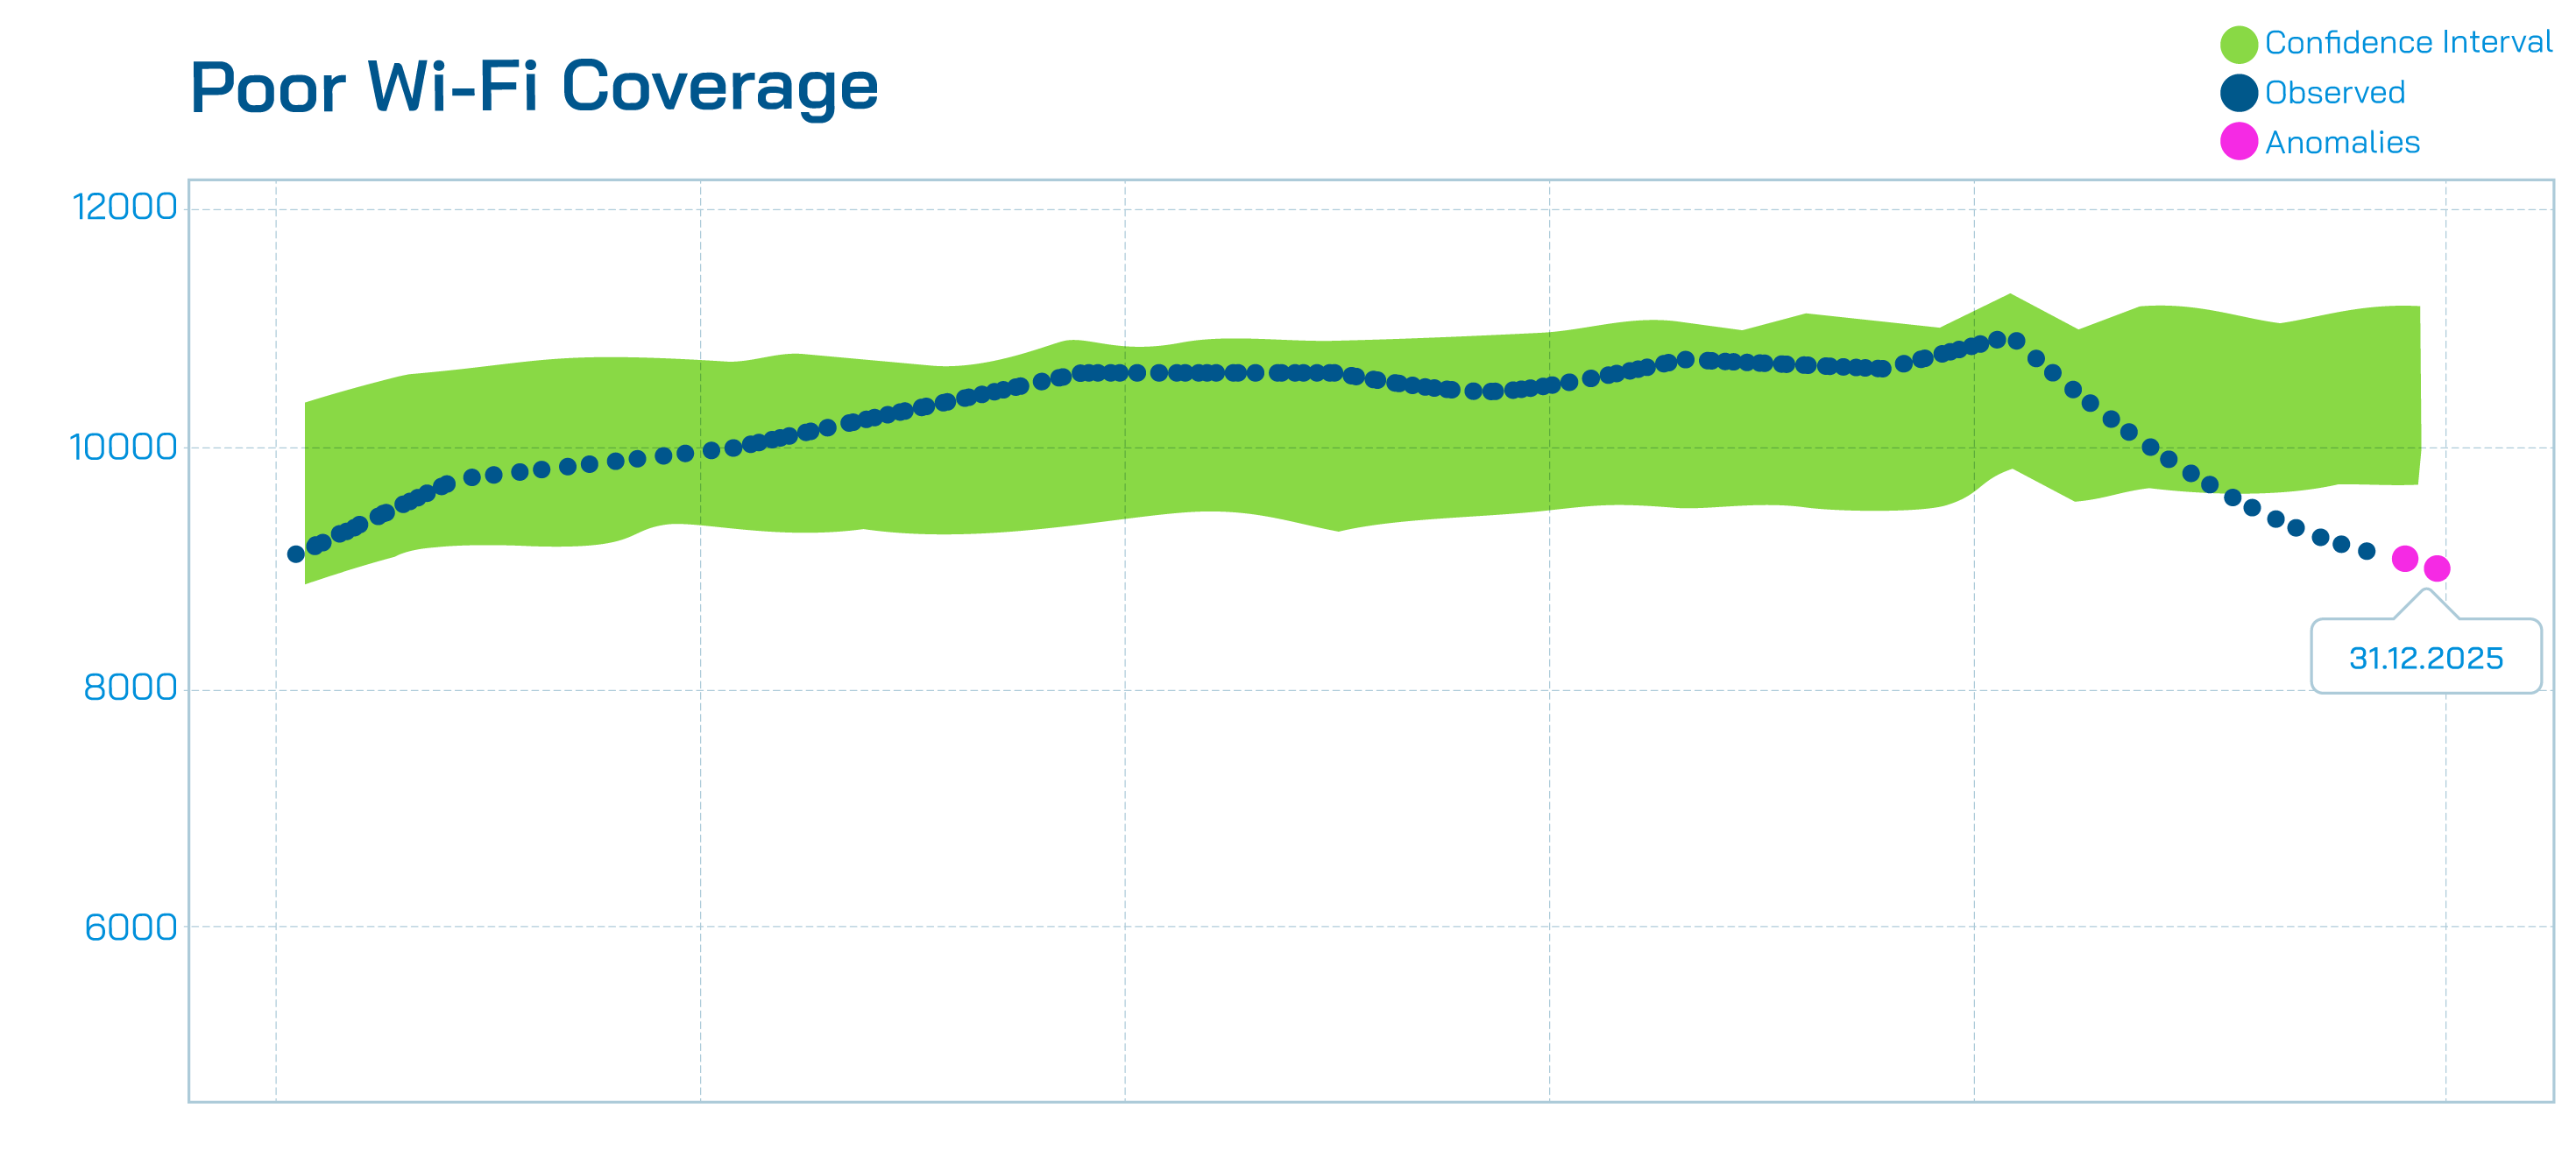
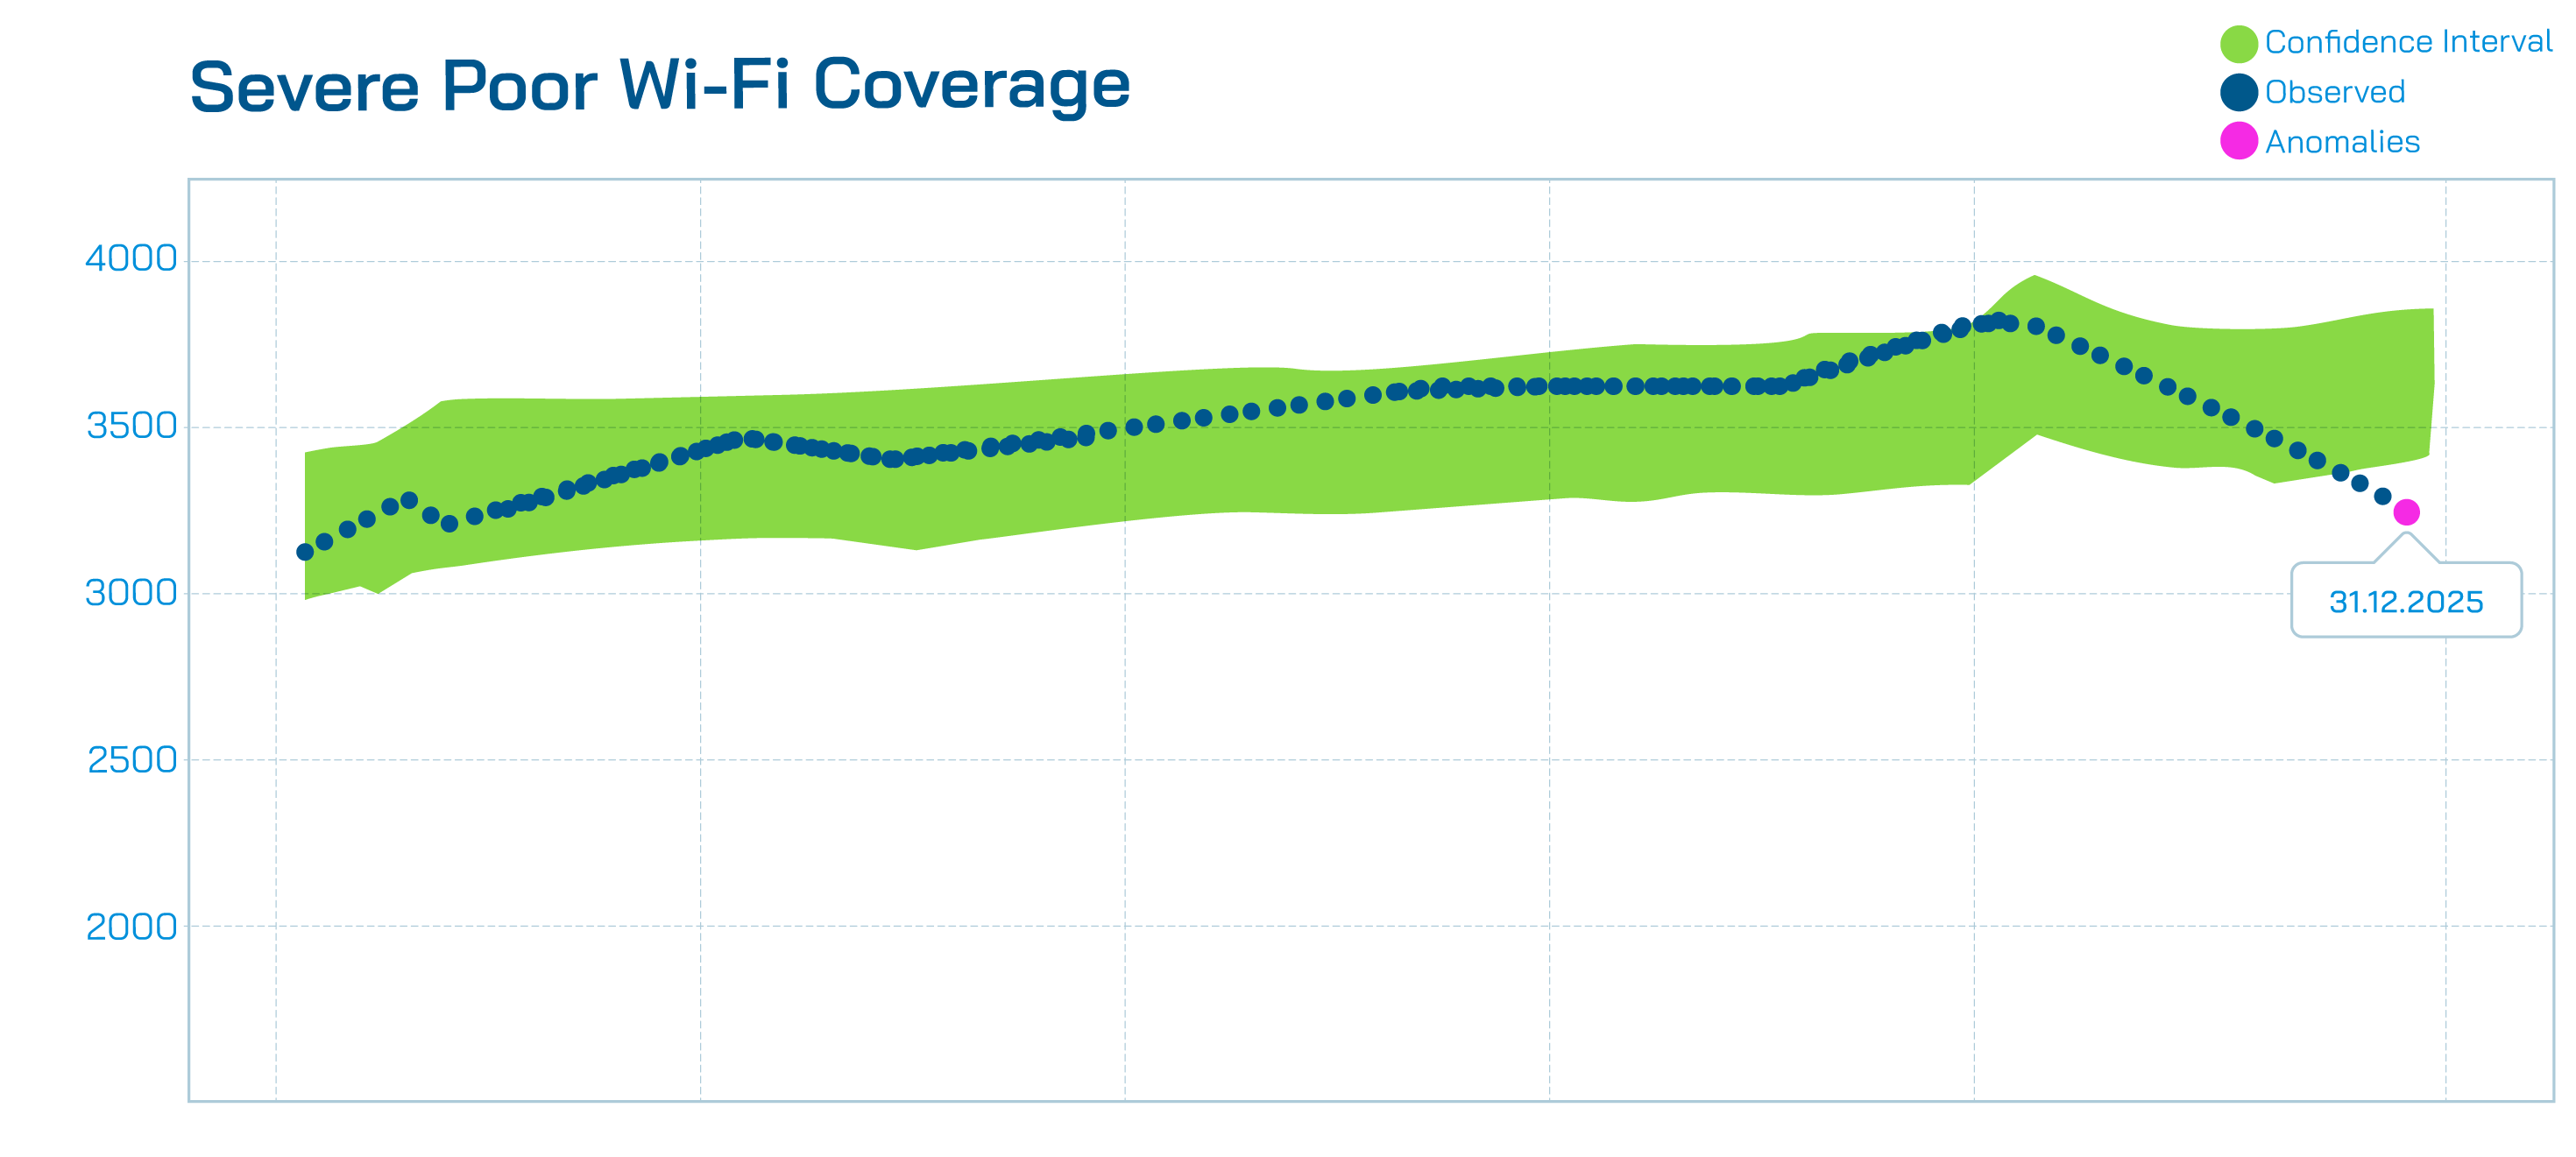
There was a clear decrease in users experiencing poor coverage during New Year’s Eve.
Two explanations come to mind. First, people who chose to celebrate outside naturally didn’t experience coverage issues at home. Second, even for users who stayed in, they were probably not sitting in the “Wi-Fi dead zones” of the house (remote corners, upstairs rooms, etc.). Instead, they were more likely spending time in central areas—like living rooms or dining rooms—closer to where the modem/router is usually located. Who knew the best Wi-Fi coverage fix was… moving the party to the living room?

New Year’s Eve stands out as a unique moment in the year where Wi-Fi usage shifts in a surprisingly consistent way across homes. Instead of the usual evening peak in activity, the data suggests a temporary drop in upload-heavy behaviour, a flatter 5 GHz airtime pattern, and a growing share of homes that run mostly on 2.4 GHz traffic—suggesting that the “main users” online might actually be smart home devices quietly doing their thing.
In other words, New Year’s Eve doesn’t only bring fireworks and celebrations—it also changes how people interact with their home networks. Whether users are out celebrating or simply gathered in the most central parts of their homes, the Wi-Fi footprint of that night tells a clear story: fewer screens, fewer heavy sessions, and a different rhythm than any typical evening.
If you’d like to learn more about how these anomaly patterns can be detected using AI, check out our blog post: “Outliers That Matter: Finding Anomalies in Wi-Fi Networks.”
.svg)
.svg)

.svg)
.svg)
.svg)
.svg)


.svg)
.svg)


