
In September 2022 a post on this site sorted the problems of home Wi-Fi into four groups: coverage, 2.4 GHz congestion, infrastructure and hardware, and the client devices themselves. It published how often each one turned up in the field. It also opened a series, and every group later got a post of its own.
Four years is long enough for that picture to change, and Wi-Fi 7 certification opened in that time. The useful question now is not whether the four groups were the right ones but which of them improved. The answer splits largely along one line. Problems that live inside a device mostly got better, and problems that live in the building around it got worse.
The 2022 figures came from the operator networks measured at the time and were published with the original post. In four years the population has changed, in the networks behind it, their technology and their geography. What has not changed is that Wi-Fi problems are still there, some larger than before and some smaller.
Each share is the total of flagged homes over the total of measured homes, so a network counts for the homes it contributes rather than for being a network. Digital subscriber line (DSL) stability is the one exception. It exists on only a small number of networks here, of very different sizes, so it is reported as the mean of the network shares taken separately. These are two measurements four years apart, not a trend through time. As in 2022 the categories overlap: one house can sit in three of them at once, so the figures do not add up to anything.
What does the data say?
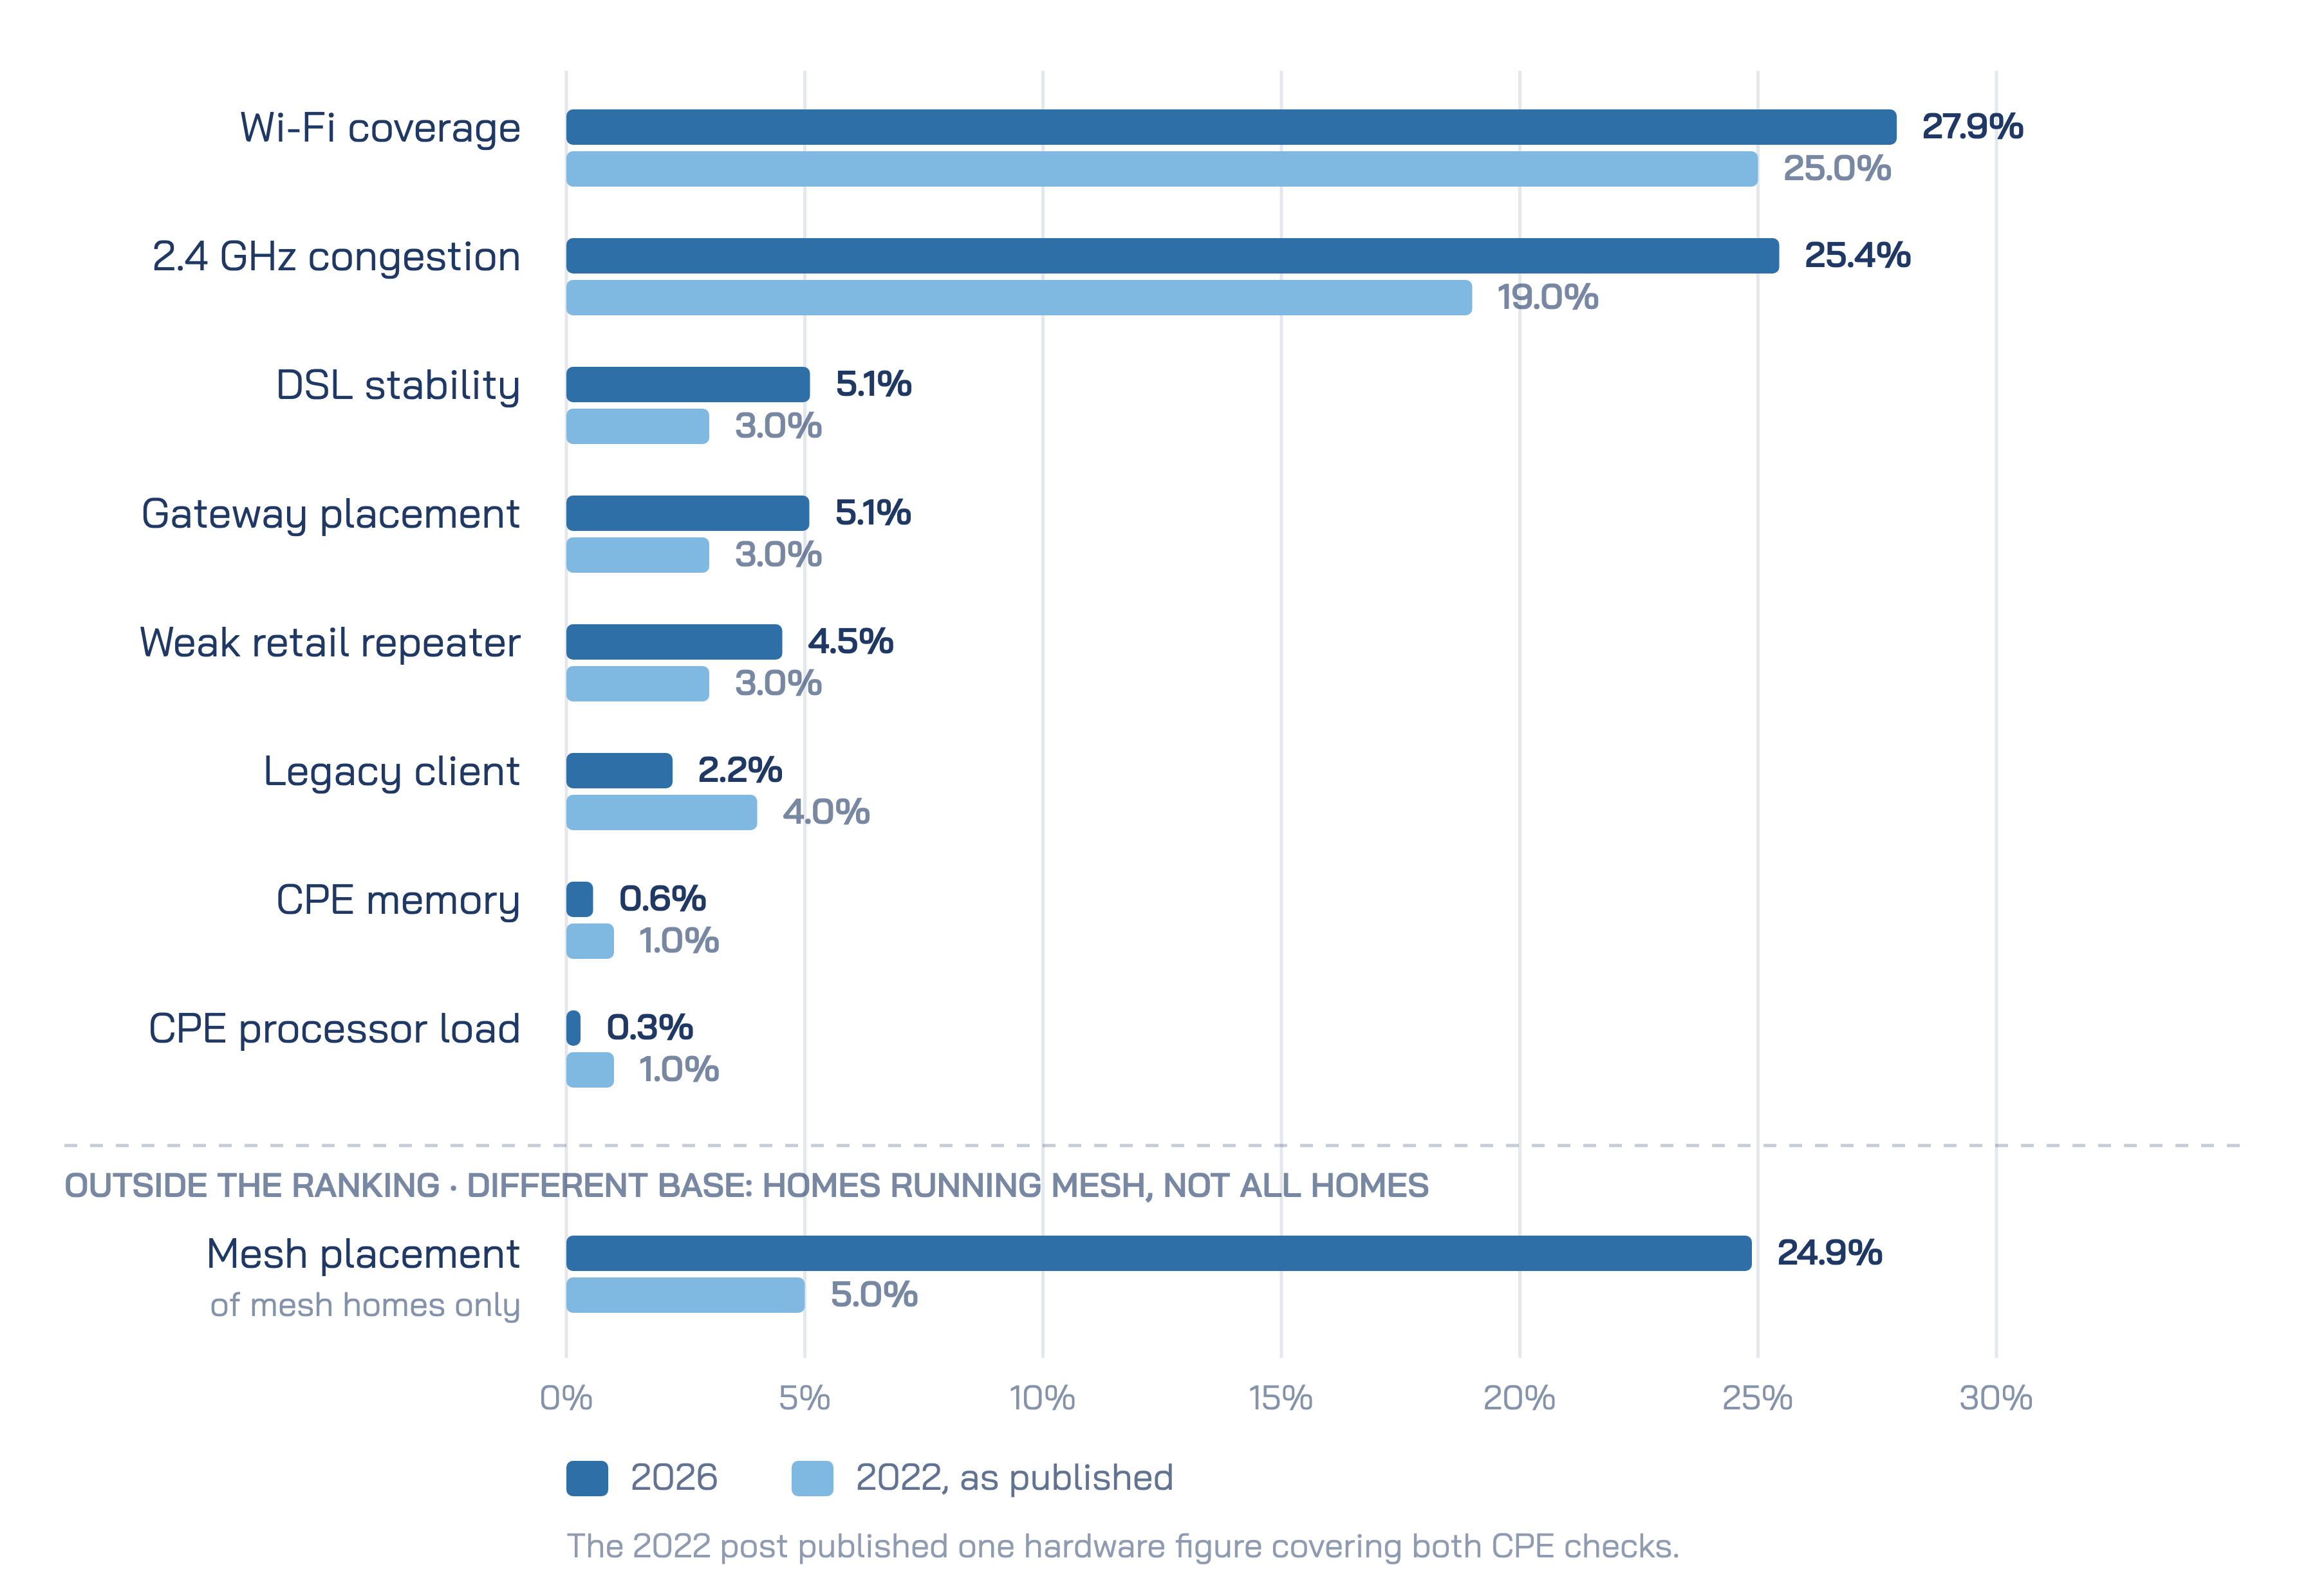
Legacy clients, the single-stream 802.11b/g/n devices that never connect to 5 GHz and hold the 2.4 GHz channel at a low rate, appear in 2.2% of homes, down from 4%. CPE processor load is flagged in 0.3% of homes, against the 1% the 2022 post published for processor and memory together. CPE memory, at 0.6%, is too close to that figure to call a change.
What follows from it?
One likely reason is household device turnover: sooner or later, an old device that could only use 2.4 GHz is replaced by one that reaches 5 GHz. Part of the fall may also be quieter devices rather than fewer of them. The check only counts an old device that is actually busy, moving a lot of data at a low rate, so one that stays connected but carries little traffic is not in this figure. The remaining cases can be surprising. In one home the client holding the channel turned out to be a dishwasher, whose legacy radio moved very high volumes of data and congested the network.
The CPE figures carry less weight, because the 2022 post folded processor and memory into one number. The processor reading still points the same way.
What does the data say?
Wi-Fi coverage is flagged in 27.9% of homes, against 25% in 2022. Gateway placement is flagged in 5.1%, against 3%. Retail repeaters with a weak link back to the gateway appear in 4.5% of homes, against 3%. Among homes running a multi-node network, 24.9% carry a backhaul placement concern, against 5% four years ago.
What follows from it?
None of these is a device fault. They describe the building, where the gateway was put and what was added when the signal failed to reach the far rooms. Building layouts do not change with device cycles, and the load they carry is high. Weekly download per home is 237.2 GB, against an average of 98 GB in the 2022 post. Today that traffic is spread across 10.8 connected devices per home.

Where the gateway sits is decided at installation, and coverage is not always the deciding factor. In one field case the technicians carried short cables, so gateways were set down next to the fibre terminal at the front door. That is a poor position for reaching the back of a house.
A faster radio does not solve this, because coverage and speed pull against each other. A wide channel spreads the radio's power over more spectrum, so it carries more data close to the gateway and reaches less of the house. A narrow channel does the reverse. An earlier post examined this trade for 160 MHz against 80 MHz.
Width has another cost as well. One operator that narrowed the 5 GHz channel on a group of gateways from 160 MHz to 80 MHz saw congested minutes during active use fall sharply afterwards. That is consistent with a narrower channel sharing its air with fewer neighbouring networks.
Where devices sit shows the pull of reach. 37.5% of radio observations are on 2.4 GHz, the band that reaches furthest, but only 21.3% of the observations in which traffic was moving. Devices stay attached to 2.4 GHz far more often than they use it.
Wi-Fi 7 addresses part of this. Its multi-link operation lets a client work across more than one band within one connection, so staying connected no longer has to mean staying on the slow band. It does not put signal into a room that had none.
For a building that one radio cannot cover, the remedy is more radios, which is what a multi-node network provides. Among the homes that run one, a quarter carry a placement concern, and across the networks measured the share ranges from 14.9% to 39.5%. A node placed too far from the gateway is left with a backhaul link too weak to serve its rooms. A node placed too close adds little reach, and the far rooms stay uncovered.
The jump from 5% to 24.9% reflects who runs mesh, not only the equipment. Far fewer homes ran mesh in 2022, according to the analyses behind the 2022 post, so the two percentages describe different populations. More mesh is good news; poorly placed mesh is not. One reading consistent with the figures is that mesh now arrives in a box and goes wherever there is a free socket. The data records placement, not installation, so that reading remains a hypothesis.
The placement figure is also correctable. In one campaign, homes flagged for poor mesh placement were sent guidance on where to move their nodes, and a large share of them improved without a technician visit. A similar campaign asked households to unplug their retail repeaters in favour of operator-managed access points, and many did. The repeater figure is the household's side of the same story: a box added to extend coverage, connected over a link too weak to do it.
None of this proves that high load produced the coverage figures. Each link is measured, but the chain between them is not. Comparing coverage flags across homes with different load, on the same networks and over the same weeks, would test it directly.
What does the data say?
The copper estates behind the DSL check sit far apart. The mean of the network shares is 5.1%, against 3% in 2022, but pooled across the networks the share is 2.0%. The four-year direction therefore depends on the method, and this post does not call it.
What can be described is the movement inside 2026. Over the 29 weeks measured, the number of homes carrying a DSL classification fell by 10.1%. The share of those homes flagged by the check rose to a peak of 2.9% mid-window and eased back to 2.0% by the last week, never falling below the 1.8% where it started.
What follows from it?
Over the 29 weeks the flagged count fell by 1.6% while the classified base fell by 10.1%, so the share in trouble did not fall with it. One reading fits that pattern. Copper is rarely replaced at random, and the lines that are easiest to move are often the ones that already worked well, short runs with clean signal and margin to spare. Where those leave first, what remains is weighted toward the harder lines. The data does not record which lines were moved. For planning, a support queue on copper has not shrunk in step with the base.
The weekly series moves too much to say more. Counted from the first week, the number of flagged homes rose in one recent week and fell in the next.
What does the data say?
A home counts as congested on 2.4 GHz when its channel stays busy for a sustained stretch of the day, and the check also records whether any client was actively using data at the time. Congestion during active use is flagged in 25.4% of homes, up from 19% in 2022, which counted the same state.
The two groups do not overlap. A home lands in the first group if congestion met active use on any day of the week, and in the second only if it never did.
-25.4% of homes had 2.4 GHz congestion while a client was using data
-38.8% had 2.4 GHz congestion that never met active use
-together, 64.3% of homes had 2.4 GHz congestion of either kind
-on 5 GHz the same split is 3.3% against 6.1%
What follows from it?
The rise deserves a closer look, because the usual suspect shrank. Legacy clients, the old devices that only speak 2.4 GHz, stand at 2.2% of homes against 4% in 2022, while congestion during active use stands at 25.4% against 19%. The space side of this post offers a better explanation. Wide channels trade reach for speed, coverage concerns are higher than in 2022, and mesh is more common while a quarter of the homes running it carry a placement concern. A phone that can use 5 GHz but cannot hear it in the back bedroom would fall back to 2.4 GHz and do its work there, on the band with the least room.
That chain is consistent with the figures above, though no single measurement follows a device from one band to the other. It points the answer away from faster standards. A standard is proven in a lab and judged in a living room, and in the living room what decides is whether there are enough radios, in the right places.
More homes met congestion only when no client was actively using data than ever met it during active use. The airtime really was full, so these are not false alarms. They simply reached no active user.
For an operator the difference is practical. A work queue built on every congestion alert holds 64.3% of homes, and in fewer than two in five of them was a client using data when it happened. The two kinds look identical unless the measurement knows whether a client was using data at the time.

5 GHz is flagged far less, partly because the check holds it to a higher bar. That is despite 5 GHz carrying most active traffic: the band accounts for 78% of the observations in which traffic was flowing, against 62% of all observations.
The original grouping holds up. What moved is the size of each problem.
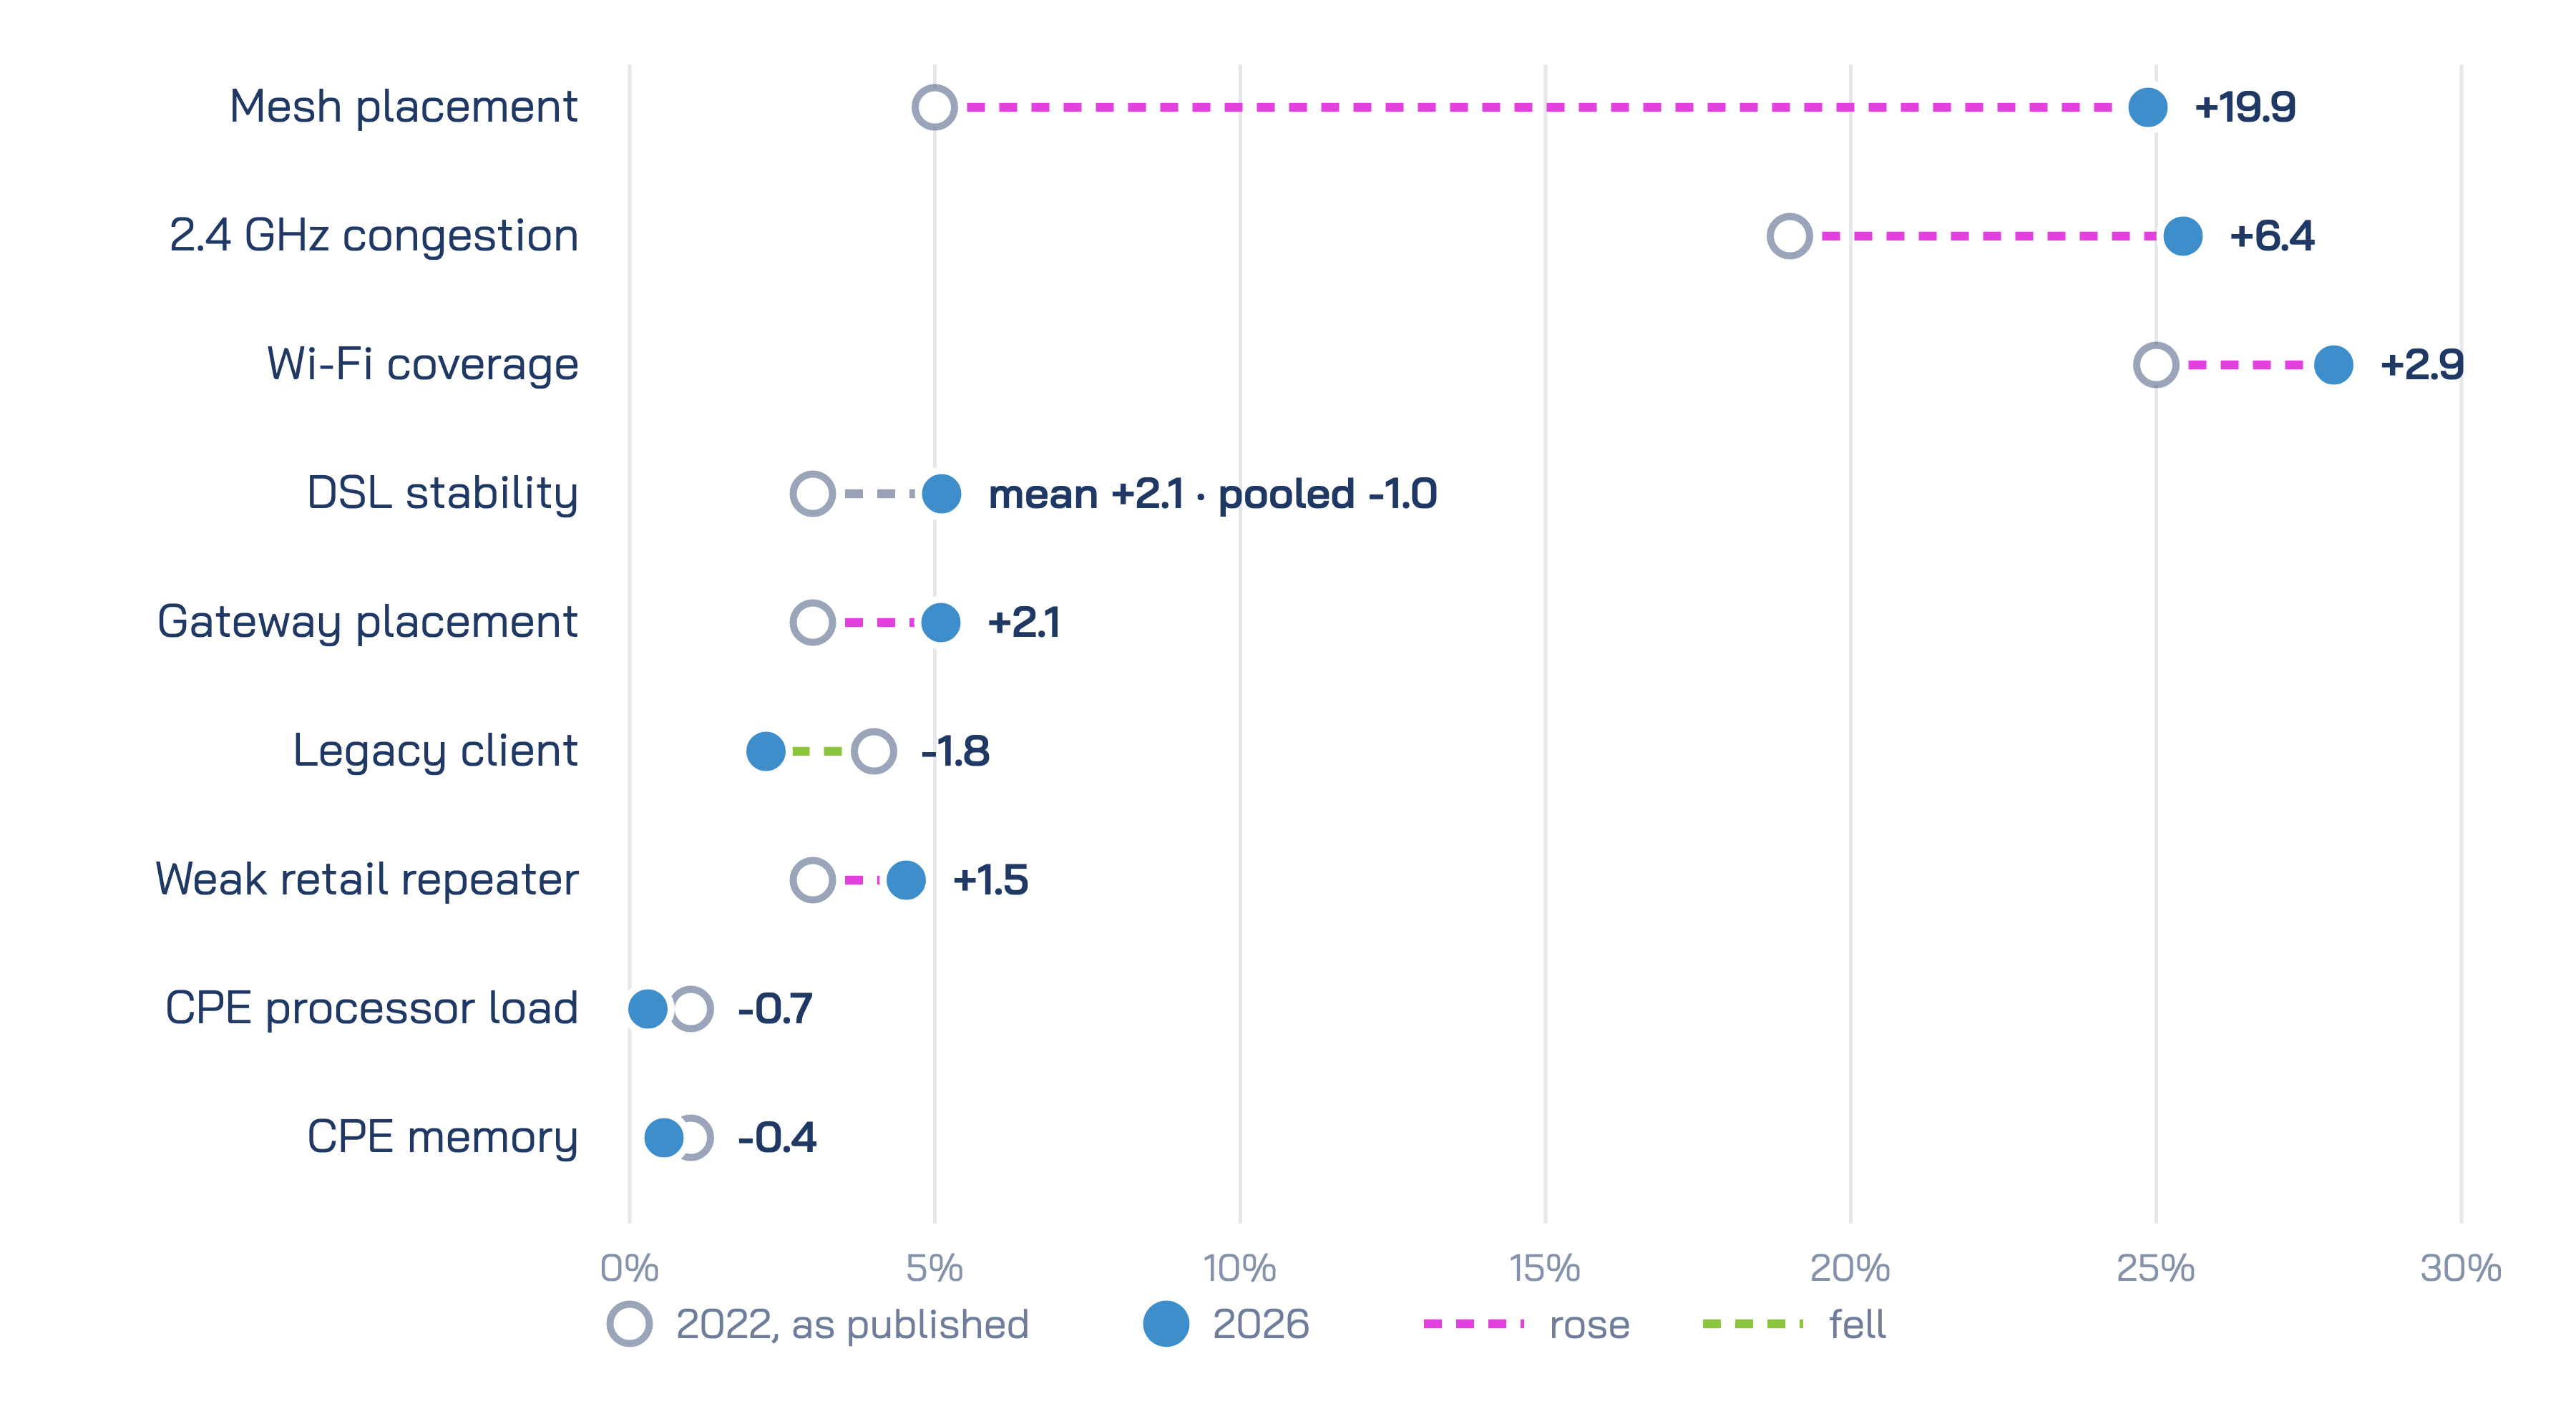
In 2022 the four groups read as a list of comparable concerns. In 2026 most of them have separated into two kinds. Client-side problems are smaller than in 2022, and CPE load is low. Problems of space are larger, at a time when the weekly load per home is high. Household device replacement alone does not reach the second kind, because it sits in the layout of the home.
That sets the order of work. Time spent chasing legacy clients goes to a 2.2% problem that is smaller than it was in 2022. Coverage, gateway placement and weak retail repeaters stand at 27.9%, 5.1% and 4.5%, and household device cycles will not fix them. The copper estate deserves a place on it too: its base is shrinking faster than the number of its homes in trouble.
Mesh placement moved furthest, from 5% to 24.9% of the homes that run it. Part of that shift comes from who runs mesh, since far more homes do now. The rest may reflect how the nodes are placed, and the mesh campaign described earlier shows that placement can be corrected without a technician.
Each distinction in this post, between congestion during active use and congestion with no active use, or between a node in the right room and one in the wrong room, becomes visible when every home is measured every day, which is the measurement Lifemote runs for the operators it works with.
The four groups were the right four groups. Four years later, the client-side group is the one that can wait.