.png)

A gigabit plan takes two clicks to buy. The router arrives in a box, the line is tested at the wall, and the wall gets what the contract promised.
The speed test on the sofa tells a different story. The number is a fraction of the one on the bill, the phone in the kitchen disagrees with the laptop upstairs, and walking closer to the router helps only a little.
That gap is a familiar complaint in home broadband, and the usual explanation stops at walls and microwaves. Measured across a large population of homes, the picture is more specific. Nearly three-quarters of the connections in those homes still run at Wi-Fi 5 or older, a generation that Wi-Fi 6 succeeded in September 2019.
The gigabit belongs to the line. The ceiling belongs to the home, and most of what sets it is not something an operator sells. Spoiler: even on the most capable gateway in these homes, clients reach an estimated 1 Gbps or more only about 5.5% of the time. Six ceilings explain why.
A note on sources. The figures below come from anonymised, aggregated data from home networks across Europe, covering millions of client connections. The operators behind them chose to measure inside the home, so this is not a random sample of the industry. "Observations" below means samples of a radio link, not units of time, traffic or devices.

What does the data say?
Wi-Fi 5 and older account for 72.9% of connections. Wi-Fi 4 alone is a quarter of all connections, at 25.1%. Wi-Fi 6 is 26.0% and Wi-Fi 7 is 1.1%.

What follows from it?
A link can only run as fast as the slower of its two radios allows. For most of these connections that limit sits below a gigabit before any neighbour takes a share of the air.
A fair objection is that the device running the speed test is often the newest thing in the house. Across every connection in these homes, only 27.1% are Wi-Fi 6 or newer. The phone may be modern. The thermostat, the printer, the kitchen speaker and the television bought in 2019 often are not, and the gateway they connect through sets a limit of its own.
The same number hides a second limit. A connection runs at the older of its two ends, so a Wi-Fi 6 phone behind a Wi-Fi 5 gateway talks Wi-Fi 5. In one network in ten, Wi-Fi 6 connections are close to absent. In seven networks in ten, not a single Wi-Fi 7 connection appears, and an eighth records only a handful. Newer devices in those homes, where they exist, find no newer radio on the gateway to talk to.
What does the data say?
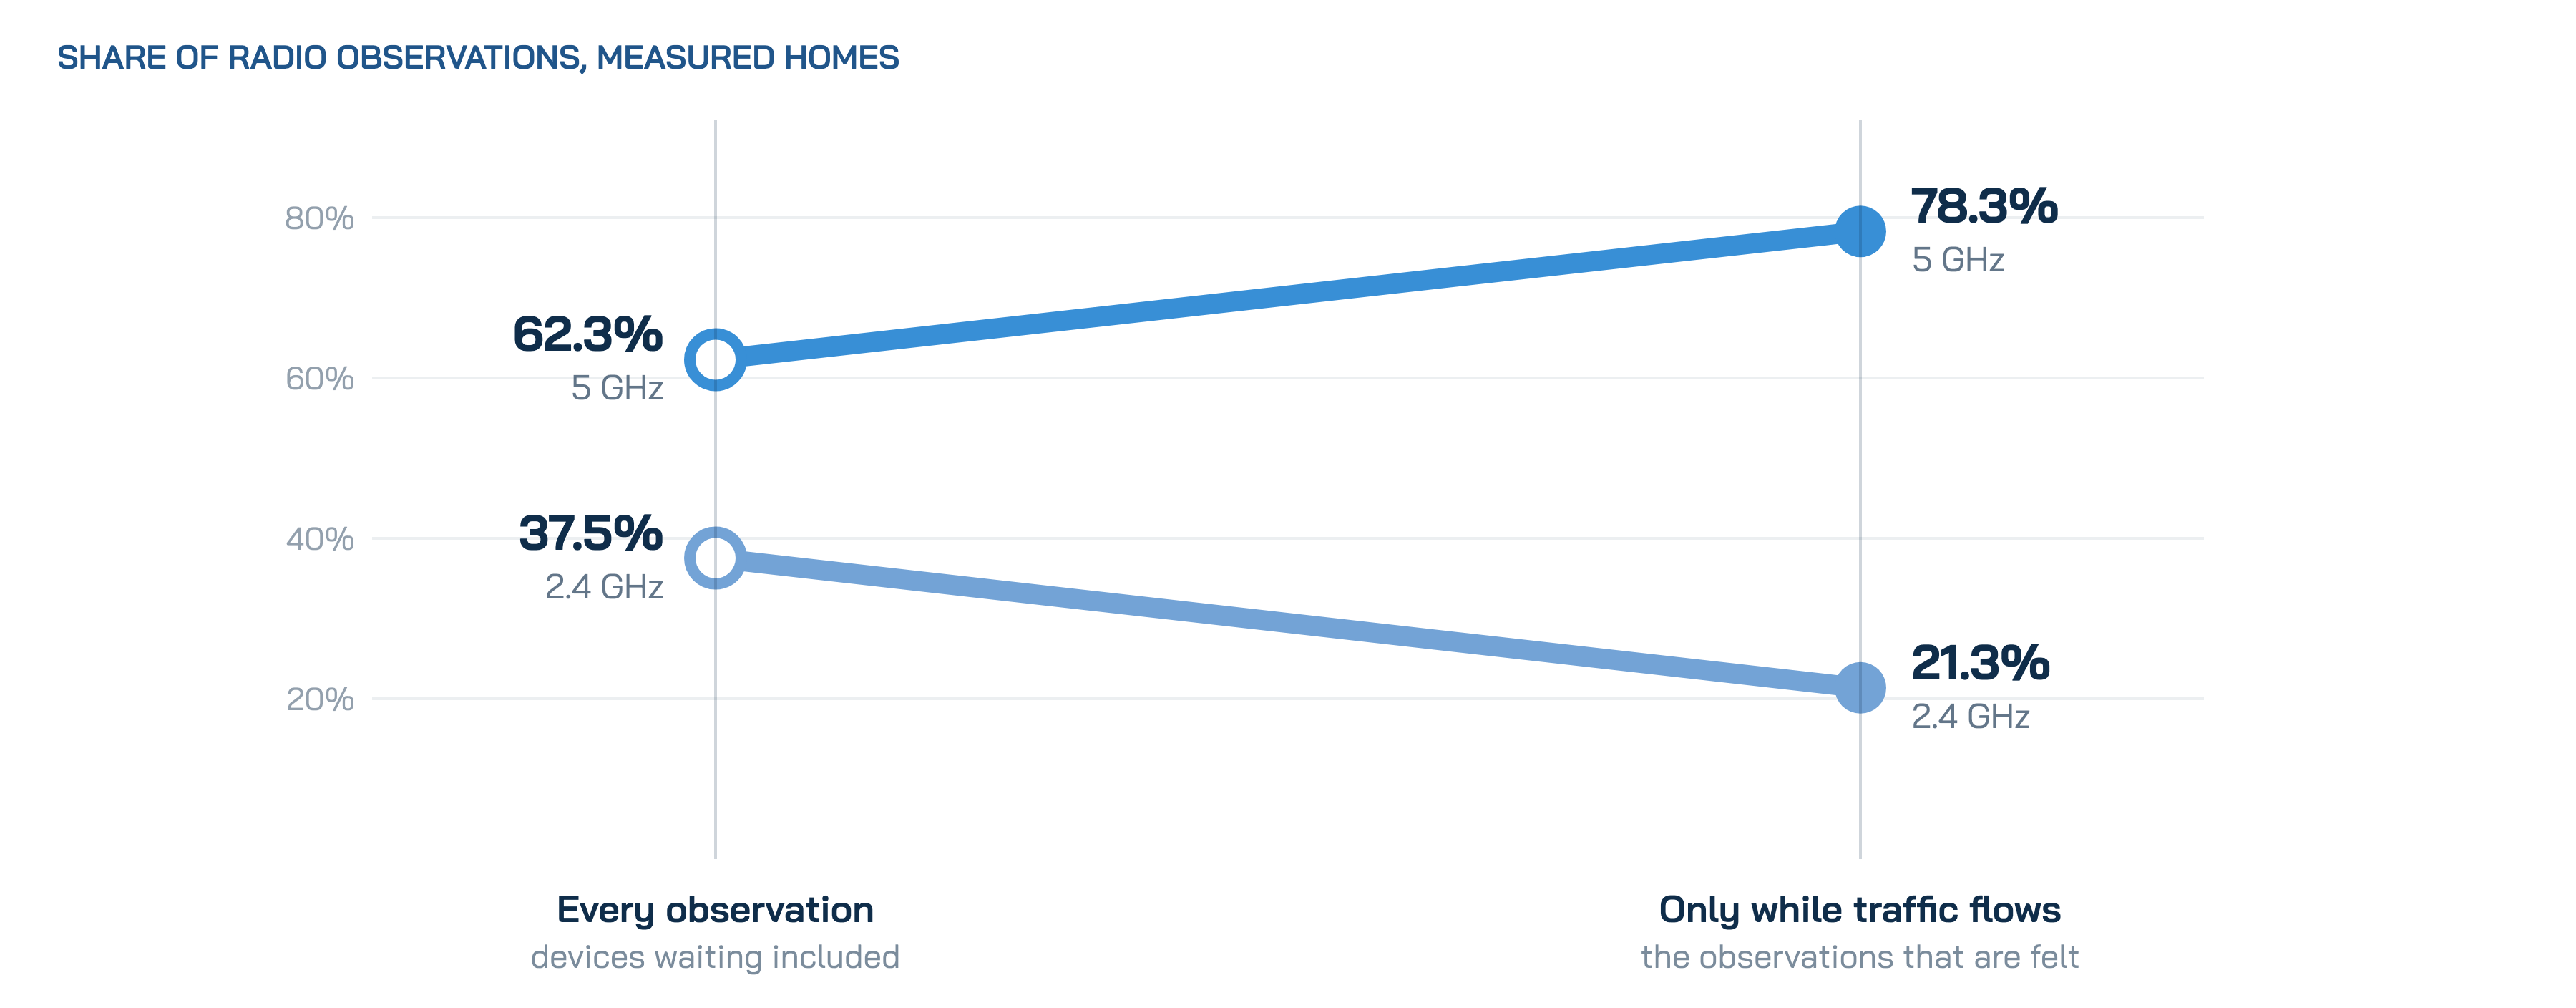
37.5% of radio observations are on 2.4 GHz and 62.3% on 5 GHz. The 6 GHz band, nearly six years after European regulators opened it, accounts for 0.16%. Counting only the observations with traffic flowing, 5 GHz rises to 78.3%.
What follows from it?
The pattern is consistent with devices resting on 2.4 GHz, which reaches further or is the only band some of them have, and moving to 5 GHz when there is something to move. The band that holds the idle connections is not the band that carries the work.
The empty 6 GHz band is partly a European pattern: Europe opened far less of the band than the United States, as the channel-width section below shows. The band needs a capable device, a capable gateway and the spectrum itself, all at once, and in Europe all three are still rare.
What does the data say?
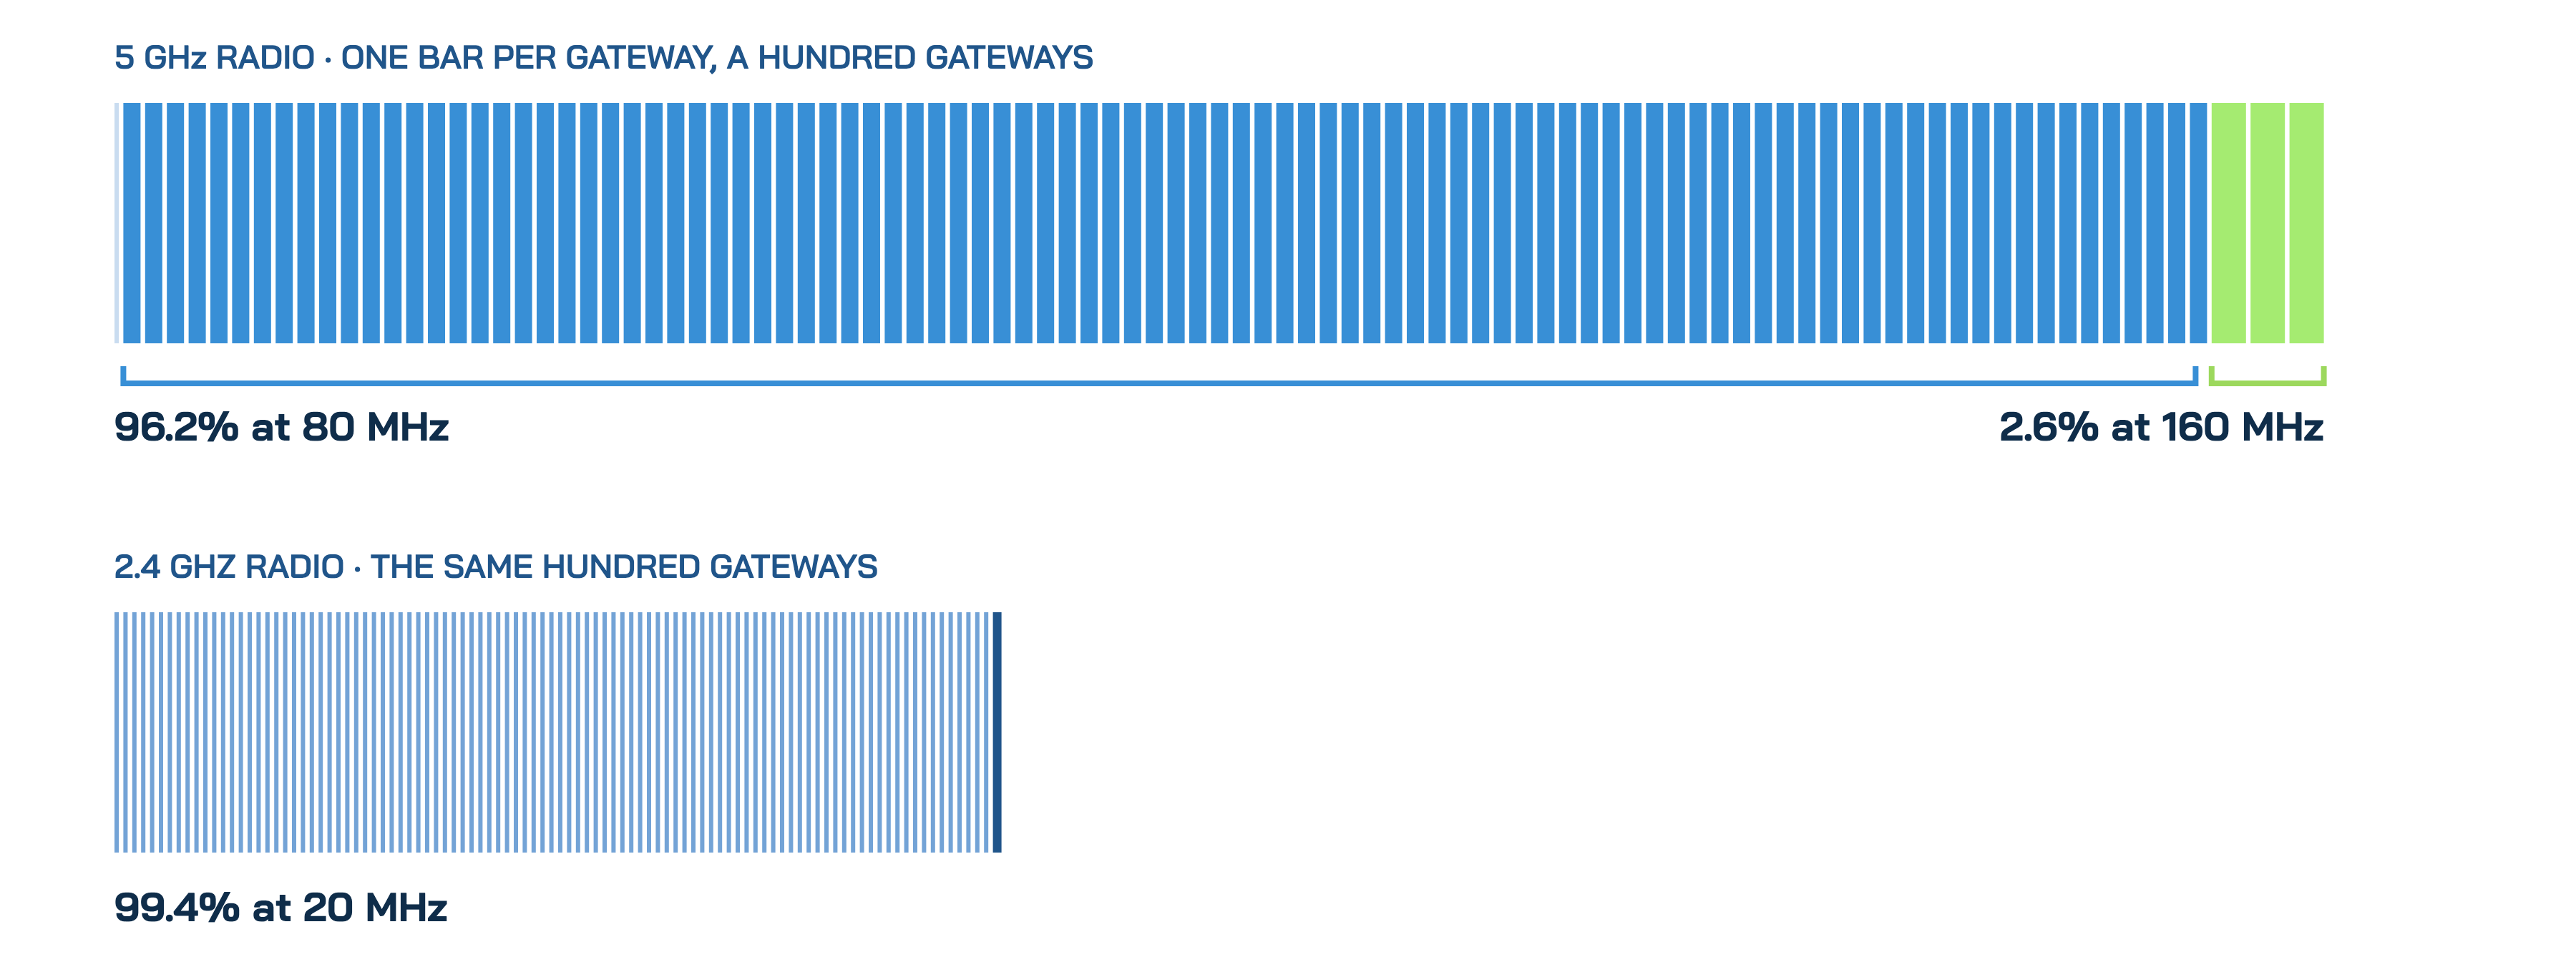
96.2% of gateways run their 5 GHz radio at 80 MHz and 2.6% at 160 MHz. On 2.4 GHz, 99.4% run at 20 MHz. The share at 160 MHz is not the same everywhere; it varies widely from one network to another.
What follows from it?
A 160 MHz channel is where gigabit-class Wi-Fi becomes comfortable, and very few homes have one. The spread between networks is consistent with a configuration choice more than a hardware limit: some networks run most of their gateways wide, others almost none.
The narrow setting on 2.4 GHz is deliberate. In practice that band offers three channels that do not overlap, each 20 MHz wide, so a wider channel there collides with the neighbours and usually carries less, not more.
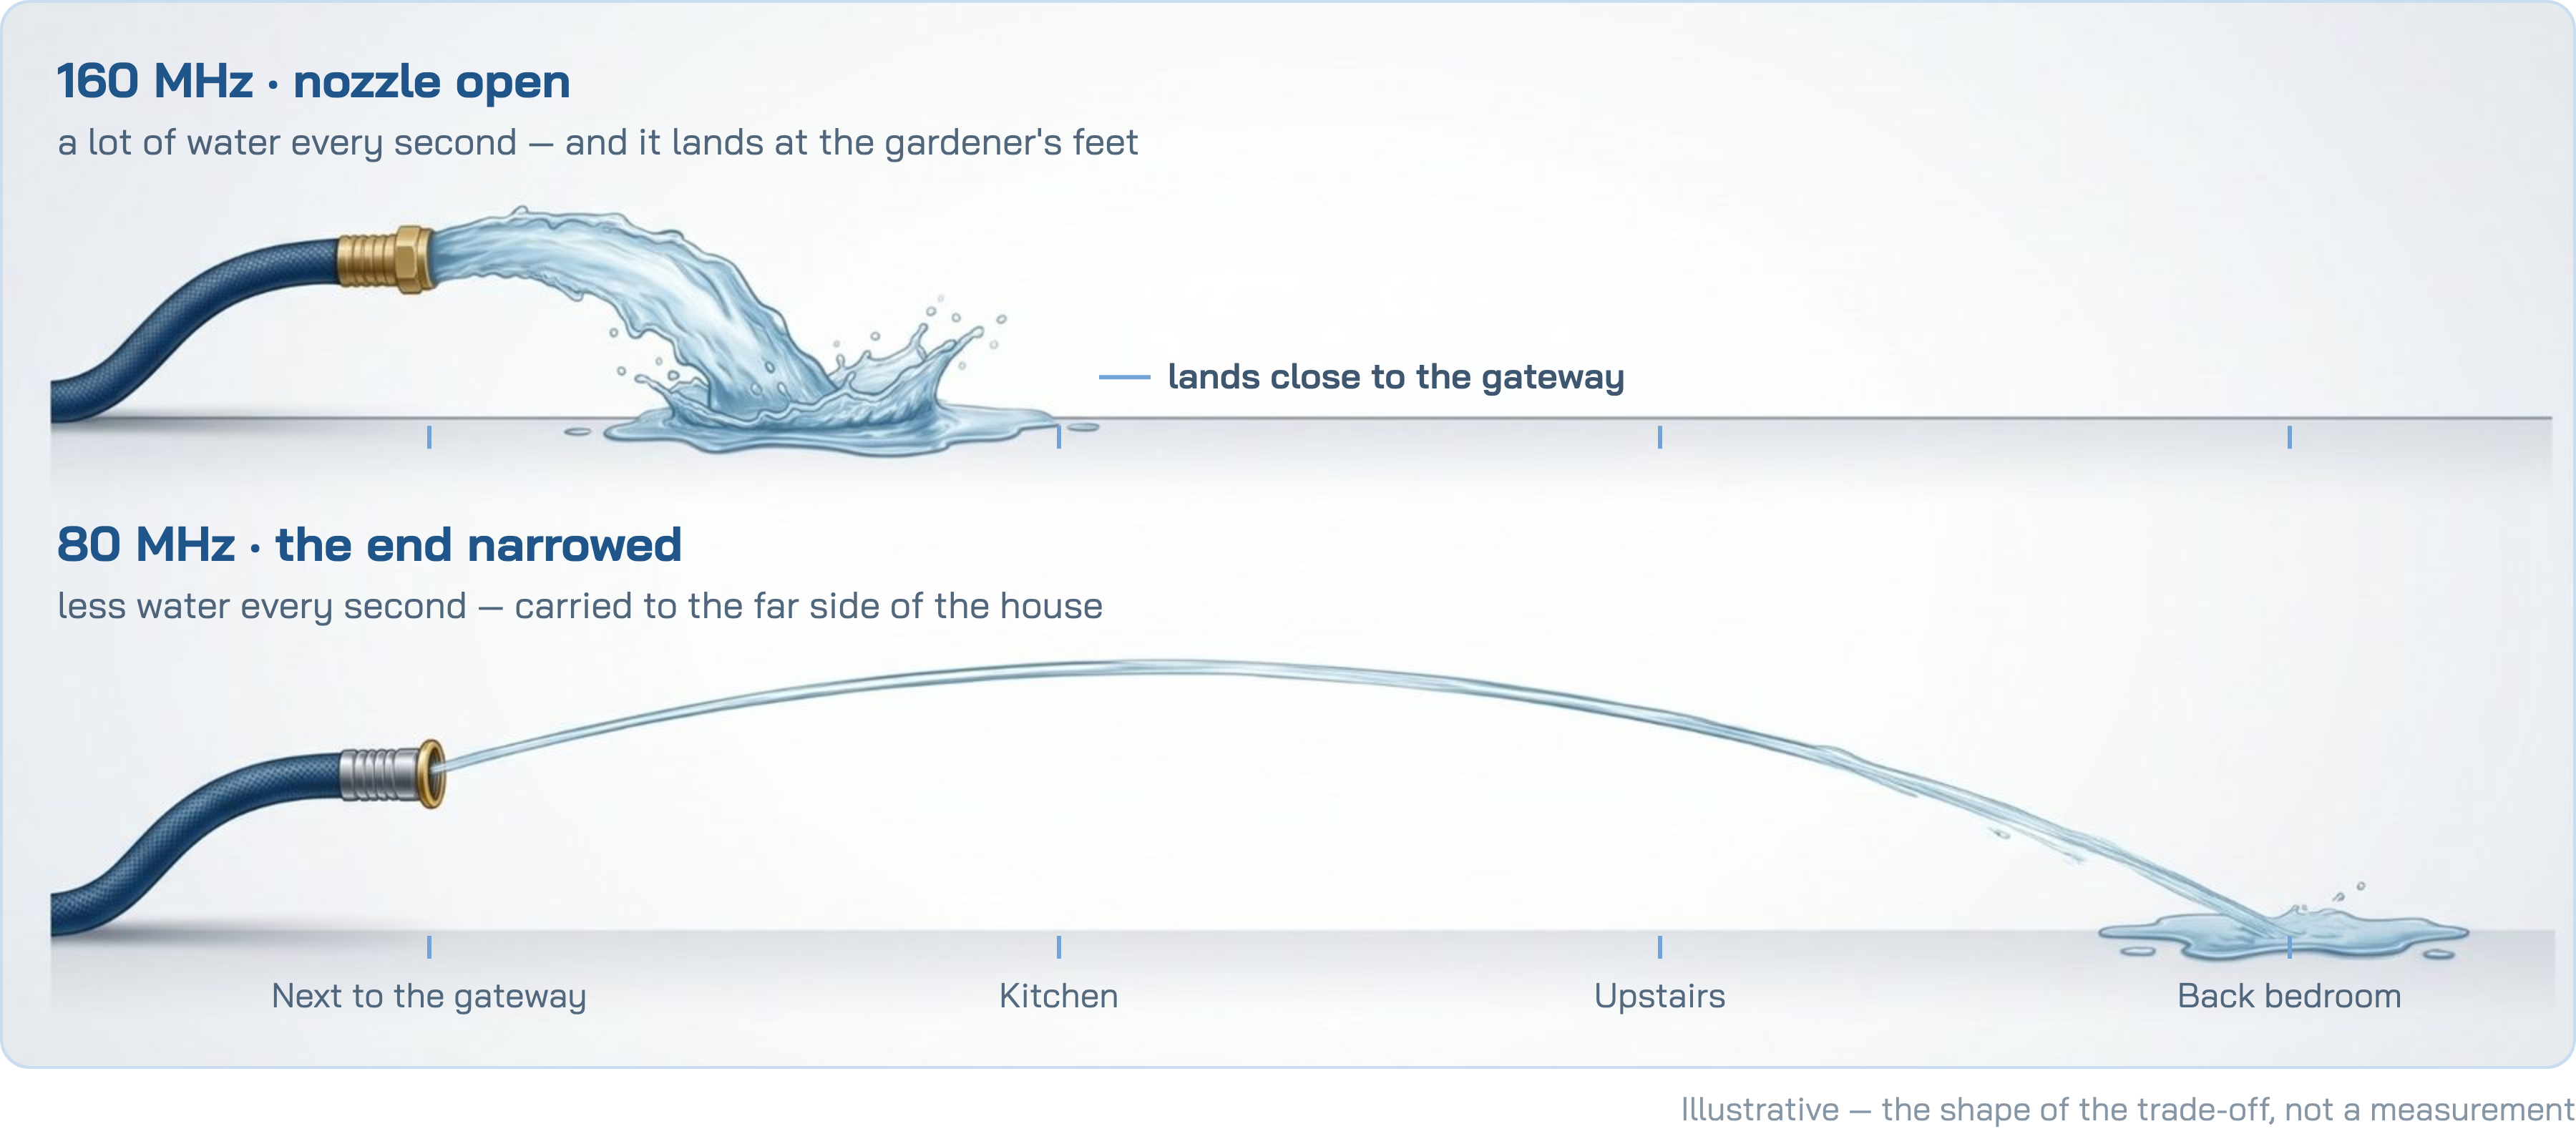
On 5 GHz the choice is a trade between rate and reach. A wide channel spreads the same transmit power over more spectrum, so it delivers more close to the gateway and less at the far end of the house. A garden hose shows the shape of it: open, it pours out water that lands nearby; pinched, it sends less water further. An earlier measurement on this site found 80 MHz ahead of 160 MHz at the mid- and poor-coverage points of a home.
Field work points the same way. One operator chose the 5 GHz width gateway by gateway, widening some and narrowing others, and the widened ones gained link rate without losing coverage. Another moved a group of gateways from 160 MHz to 80 MHz, and most of them came back with better link rates and stronger signal. A third saw devices spend more of their time on 2.4 GHz after a gateway model with a 160 MHz default arrived. That is consistent with the wide channel reaching less of the home.
So the honest reading of 96.2% is not that operators chose wrongly. Within most networks width is set for the whole fleet or by gateway model, not home by home, when the right width depends on how far the devices sit from the gateway. That is also why width and coverage cannot be fixed separately.
Europe has less room to work with than the United States. In April 2020 the Federal Communications Commission opened 1,200 MHz at 6 GHz for unlicensed use. Europe followed that November, through a decision of the European Conference of Postal and Telecommunications Administrations, opening 5945–6425 MHz: 480 MHz. The United States opened two and a half times as much. In November 2025 the European Radio Spectrum Policy Group advised that 540 MHz of the upper band be prioritised for mobile networks. The remaining 160 MHz is held back until after the 2027 World Radiocommunication Conference.
The headline feature of Wi-Fi 7 is the 320 MHz channel, which the Wi-Fi Alliance describes as "available in countries that make the 6 GHz band available to Wi-Fi." 480 MHz holds a single non-overlapping 320 MHz channel, so a neighbour also running 320 MHz has to share it. Where 6 GHz is deployed in these homes, 0.5% of those radios run at 320 MHz.
What does the data say?
Every home is checked for a set of separate problems, and each check rates the home every week as high risk, medium risk or healthy. On Wi-Fi coverage, 27.9% of homes are high risk, the most common high-risk rating among the checks shown here. A further 22.3% are medium risk, and those homes lose speed too, so the high-risk share is a floor. Across networks, between 10.9% and 18.9% of client-days are spent in poor coverage.

A home can be high risk on several checks at once, so the shares do not add up. Somewhere between 28% and 81% of homes carry at least one high-risk rating; the measurement gives the range, not the point. If the checks were independent, about 59% of homes would carry at least one high-risk rating. Figure 7 sorts the same high-risk ratings into families. Congestion and clients and coverage and placement each account for about 40 ratings per 100 homes; CPE hardware accounts for less than one.

What follows from it?
Rate falls with signal. A device at the edge of the gateway's reach negotiates a lower rate, and each step down removes speed from the link. A gigabit line into a home whose back bedroom sits at the edge of coverage is, for that bedroom, a much slower line.
A faster gateway alone does not solve that. The usual fix is to stop asking one radio to cover a whole building, which is what a multi-node network does. About one home in eleven now runs one: 9.1%.
Placement decides whether it works. About a quarter of homes running mesh, 24.9%, carry a placement concern, high or medium risk. The check behind that figure looks for two opposite faults. Nodes too far apart are left with a weak link between them, and that link caps every device that connects beyond it. Nodes too close together add little the first one was not already covering and can interfere with each other. They also leave phones and laptops with no clear choice of which node to join, so a device may hold on to a distant node while a nearer one sits idle. Either way the house pays for coverage it does not get.
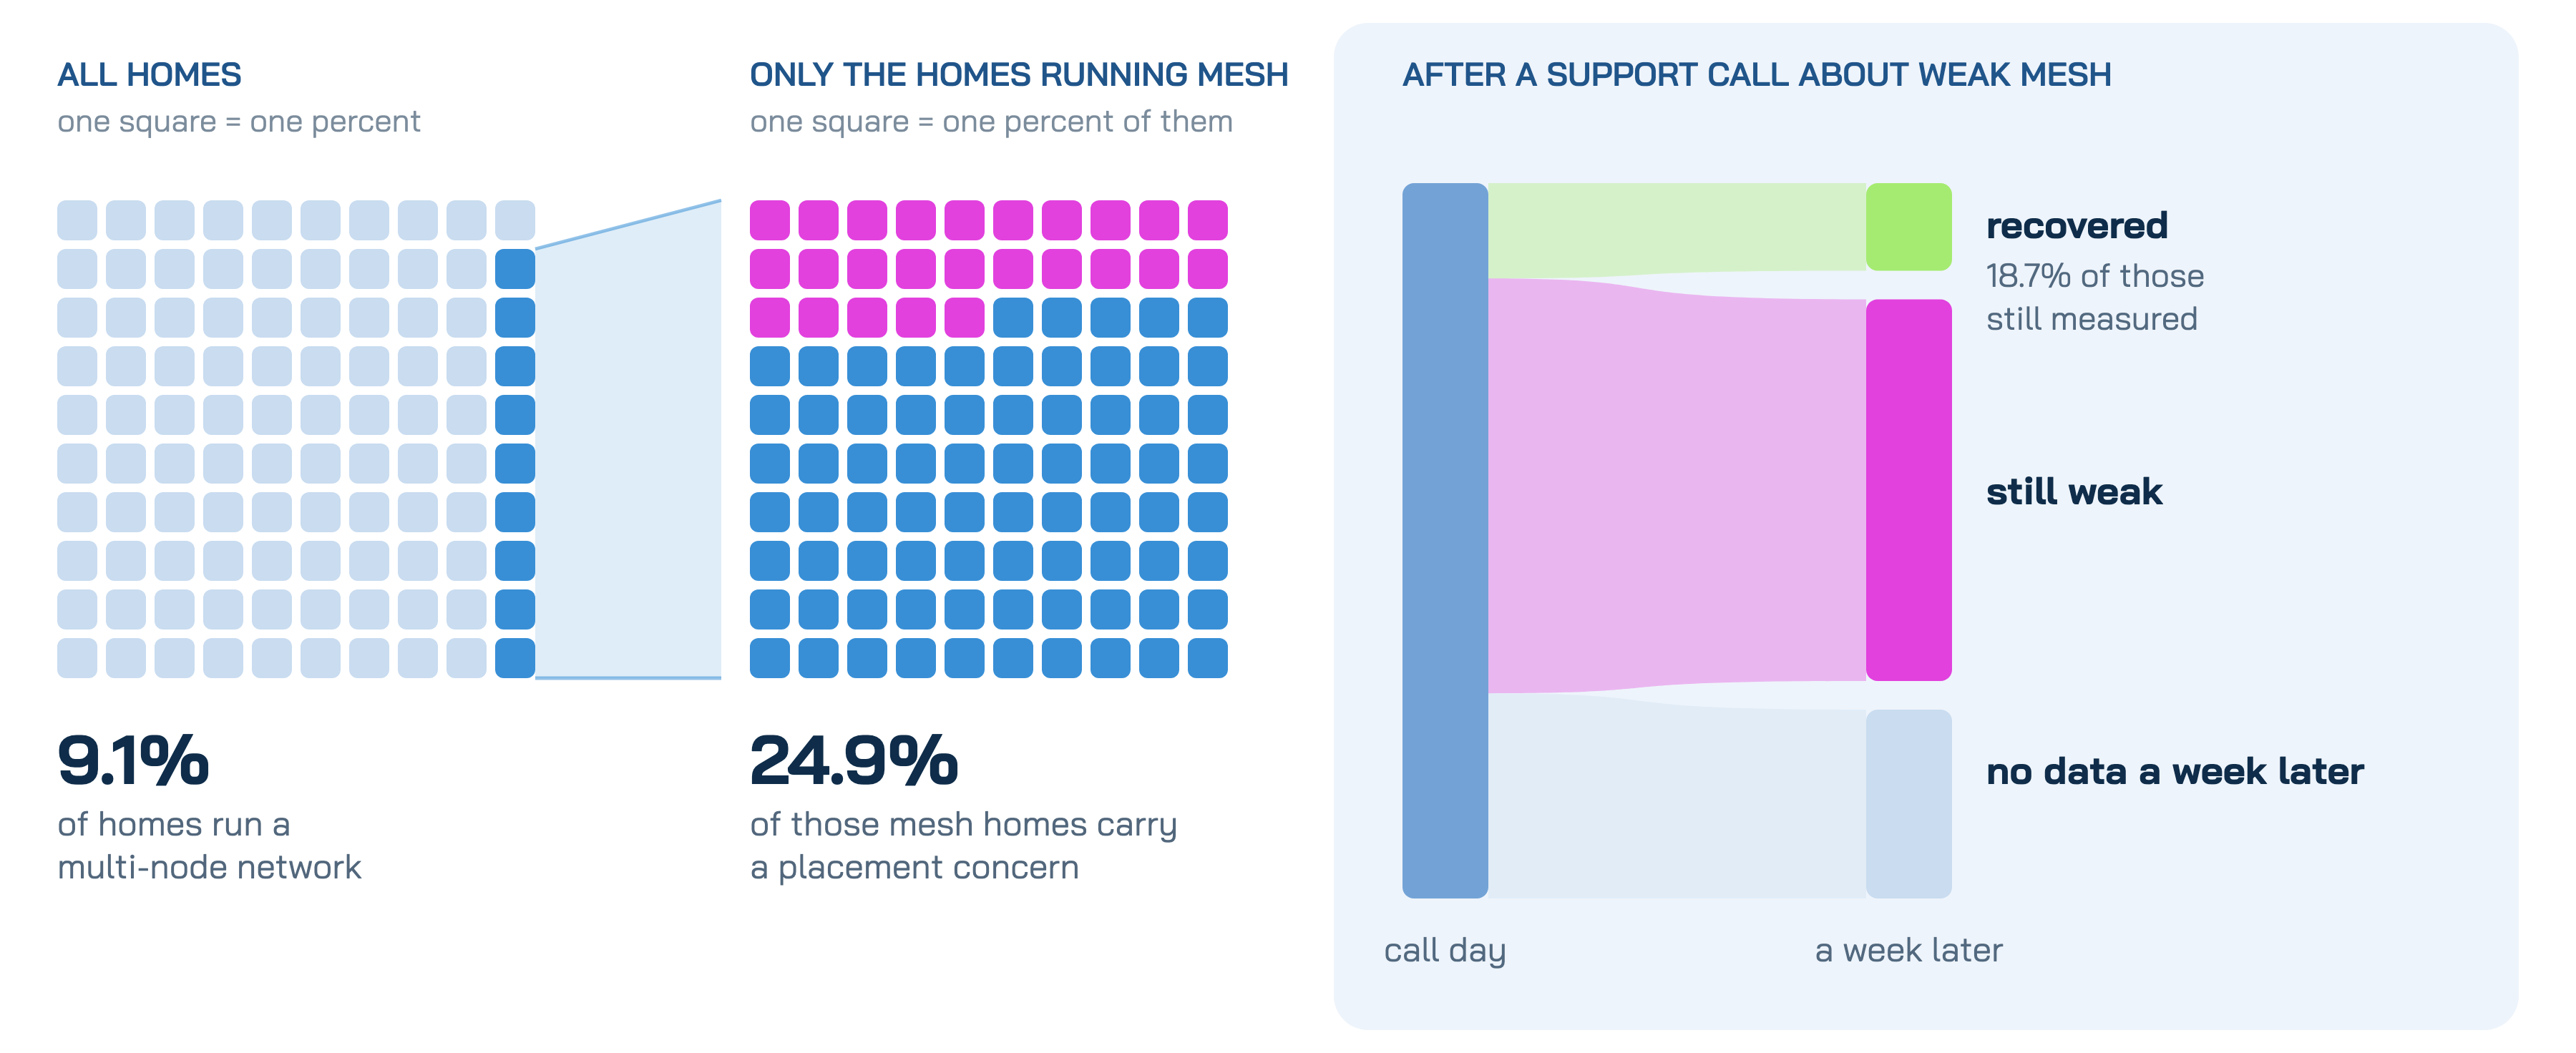
Of the homes that called support about a weak mesh link, 18.7% of those still measured a week later had recovered; the rest were still weak. A placement fault is physical, and a call alone does not move a node.
Some households do not wait for the operator. They buy a range extender off the shelf, a box that nobody on the network side manages. 4.5% of homes have one whose own link back to the gateway is weak, which caps every device that connects through it. And homes with a retail repeater spend a larger share of their active time in poor coverage than homes overall, in all ten networks measured. The repeater was probably bought because coverage was already poor, so this does not show that it made things worse. It does show that it did not close the gap.
The reason is in how the two kinds of equipment work. A managed multi-node system has one controller that sees every access point, every client and every link between nodes. It uses that view to choose channels, steer devices and pick the best path between nodes (Wi-Fi Alliance). A retail extender has none of that. It repeats what it hears from the gateway with no shared view of the home. Nothing coordinates which point a device should use, so a device may stay attached to whichever one it found first.
What does the data say?
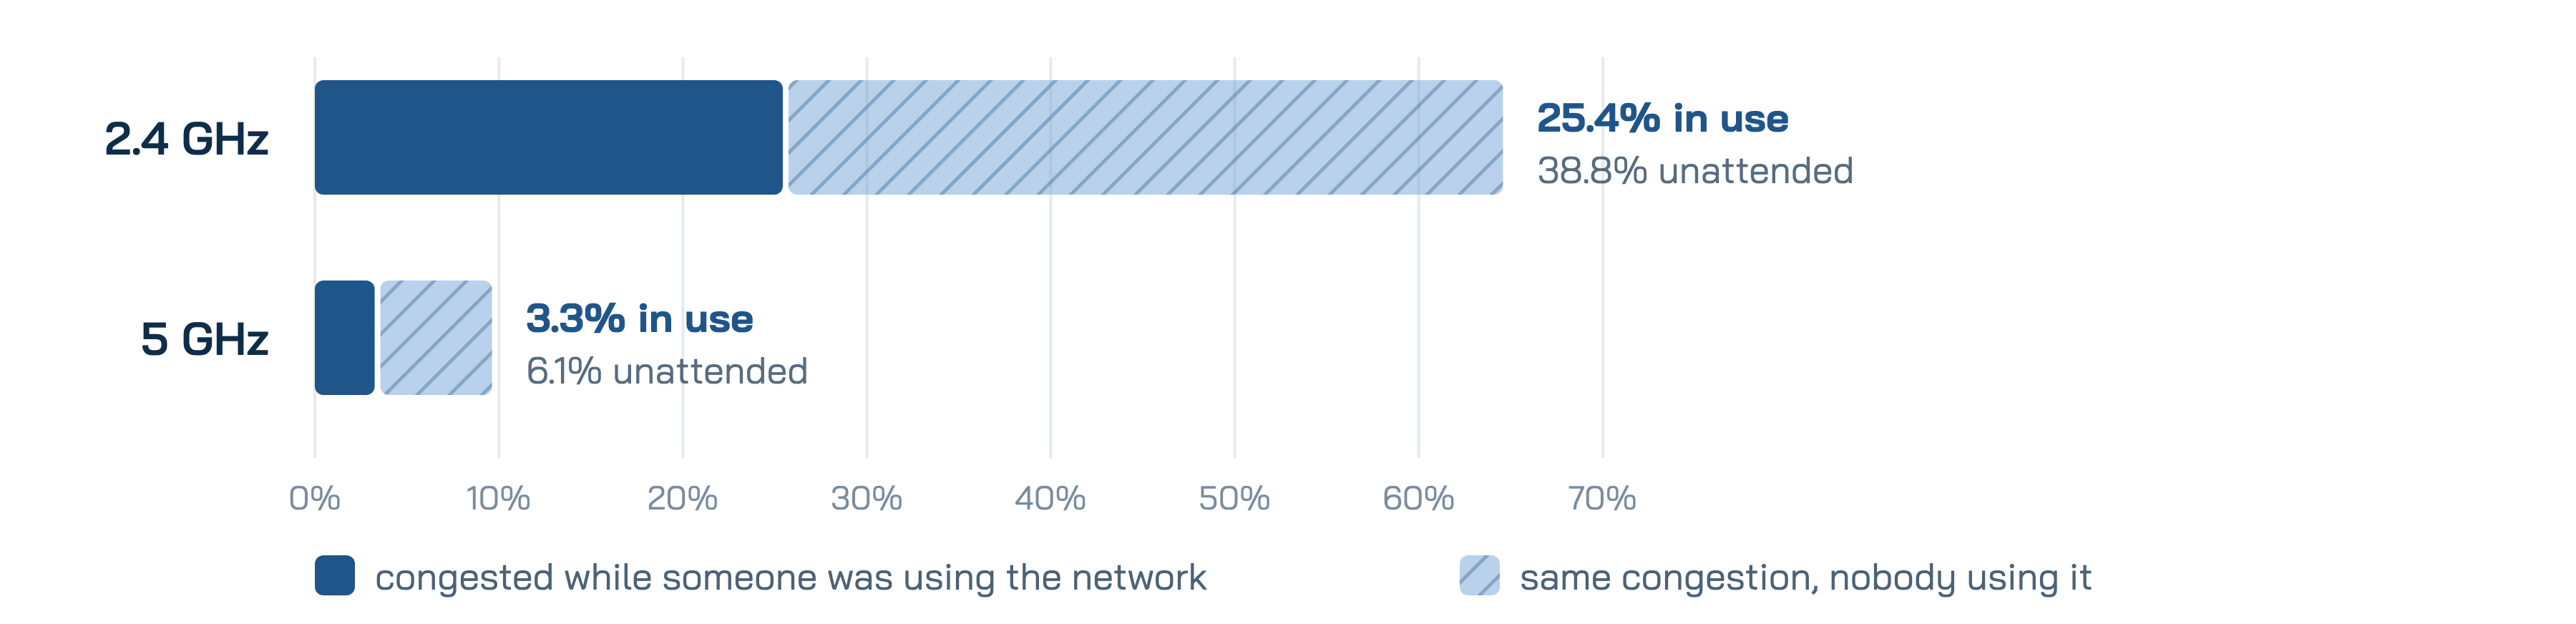
On 2.4 GHz, 25.4% of homes show congestion while a device is in use, and 38.8% show the same congestion when nobody is using the network. On 5 GHz the shares are 3.3% and 6.1%.
What follows from it?
Congestion is airtime taken by something else: a neighbour's network in the flat upstairs or the house next door, or a device that is not Wi-Fi at all, such as a microwave oven, a baby monitor or a Bluetooth speaker. It is common on 2.4 GHz, where nearly two in five radio observations sit, and rare on 5 GHz.
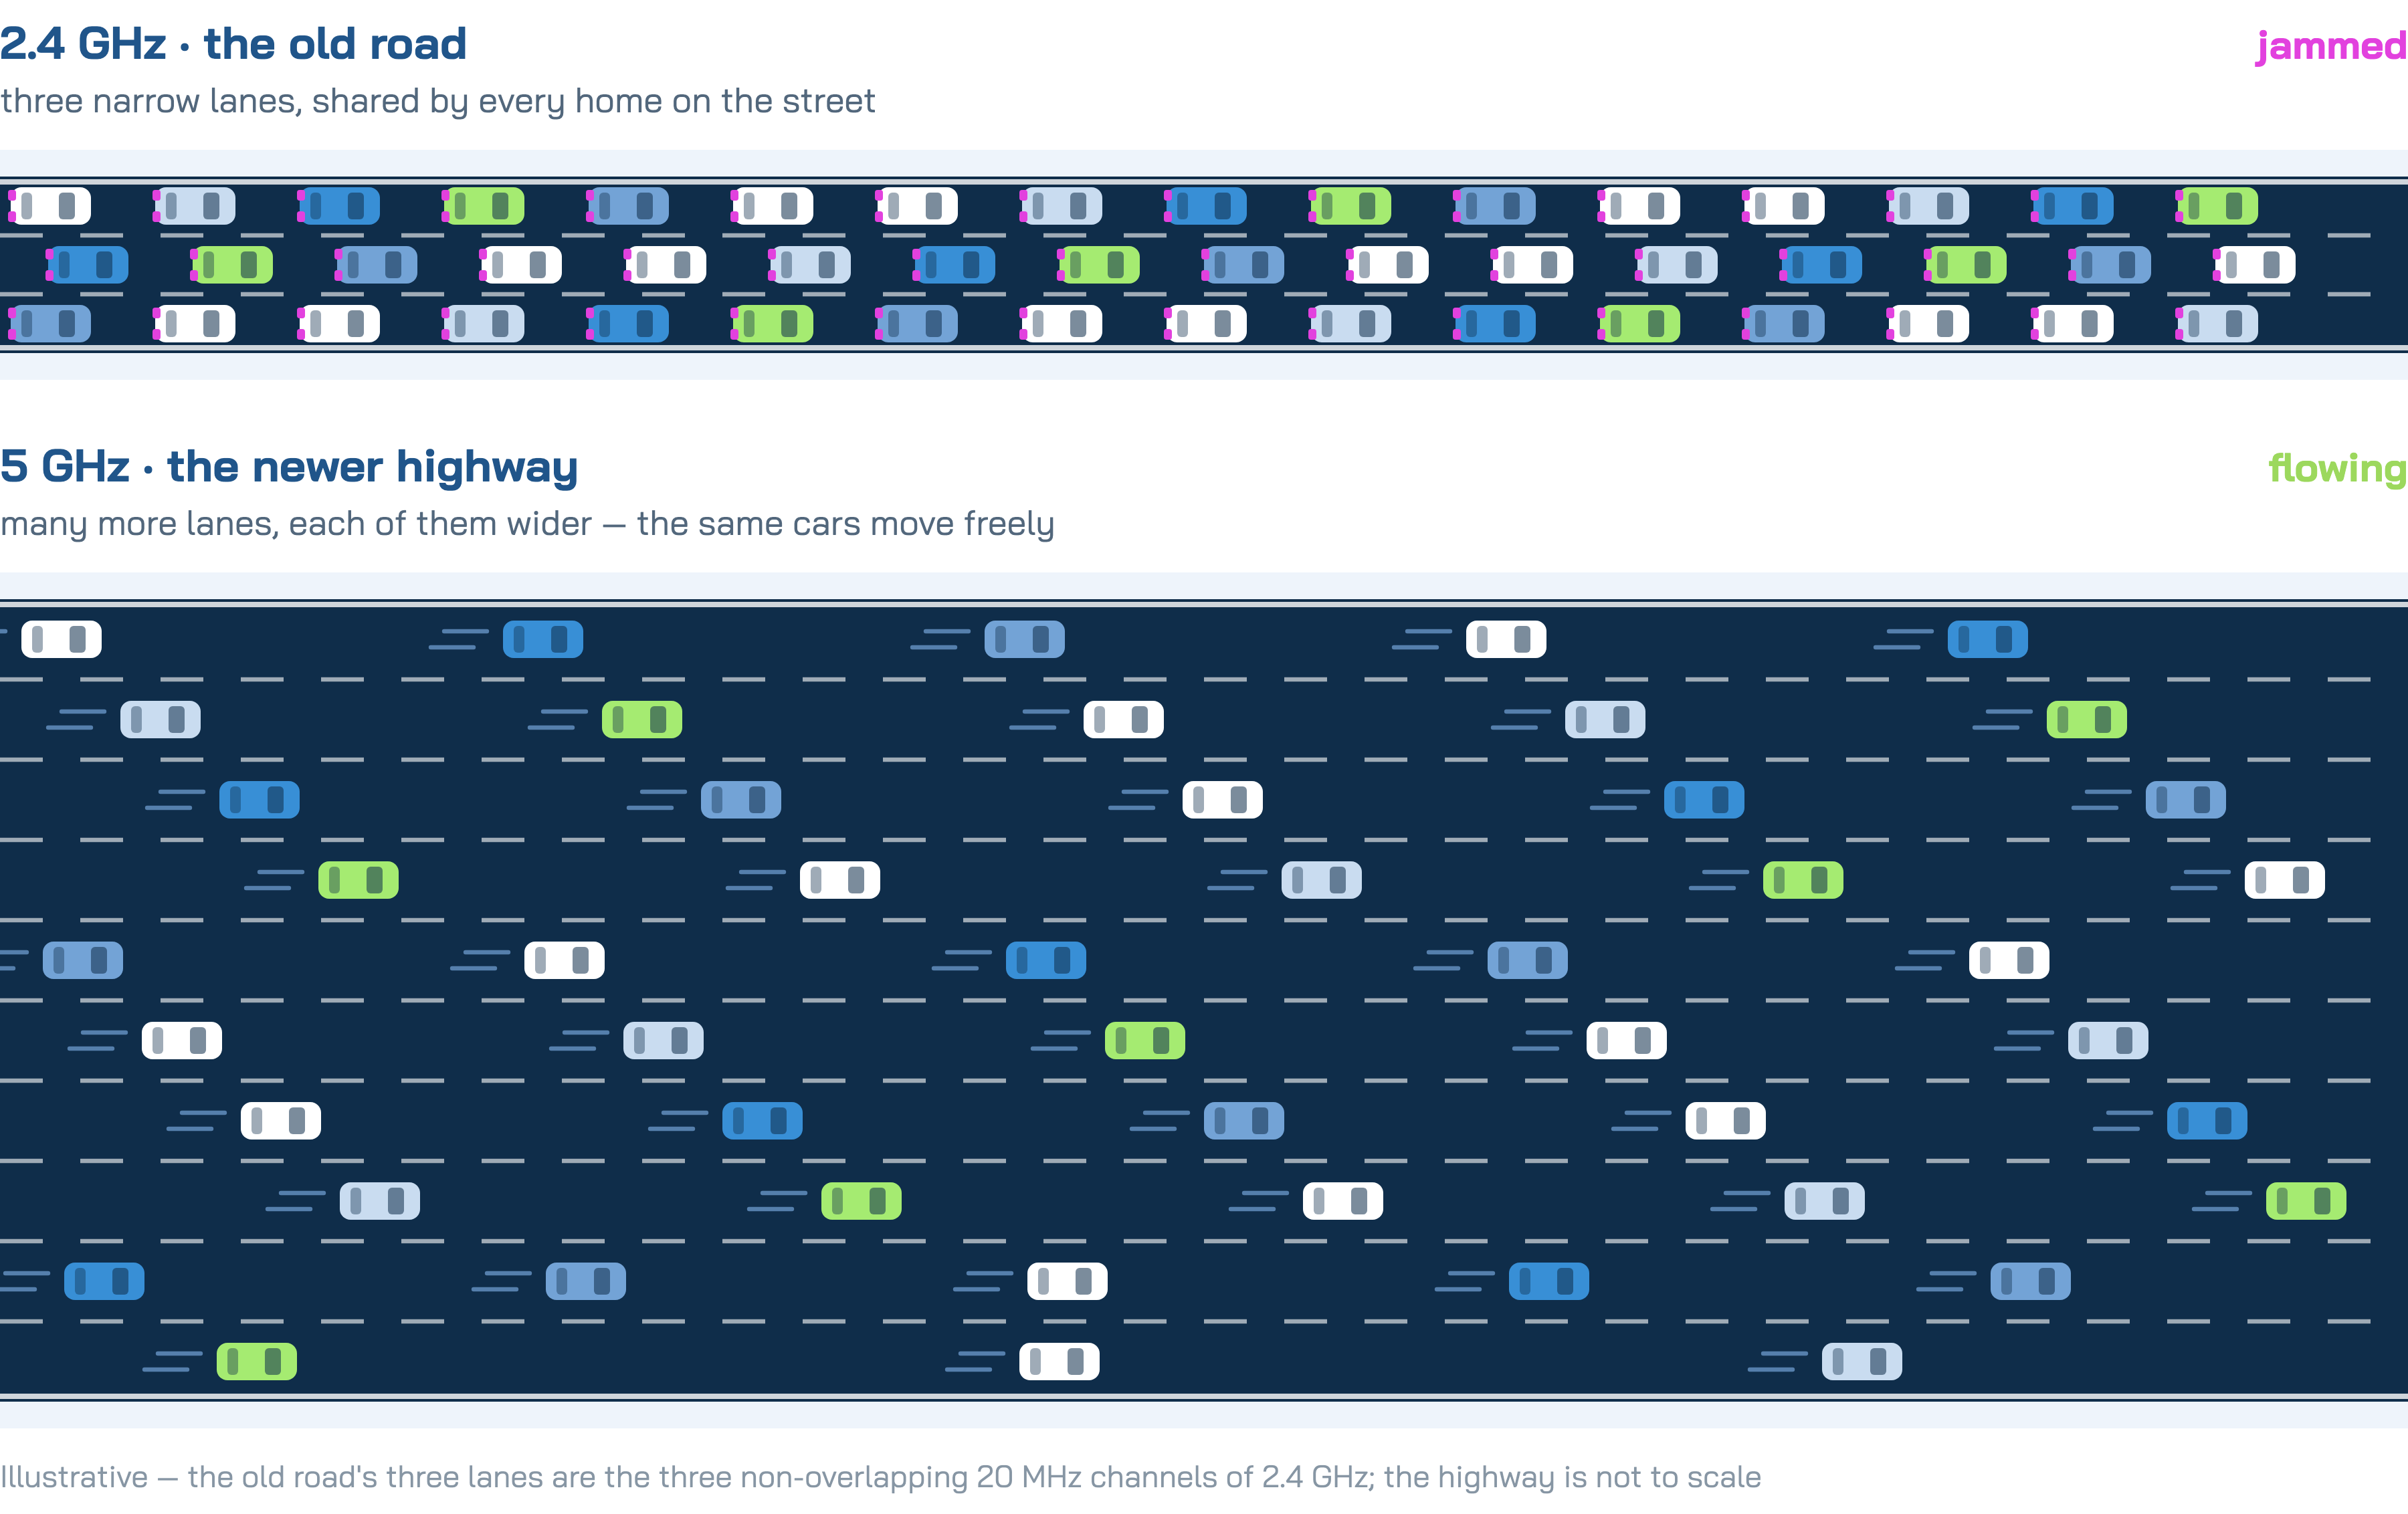
The difference is space. 2.4 GHz has only three channels that do not overlap one another, and every home on the street shares them; 5 GHz has many more, and wider ones. A three-lane road and a wide motorway can carry the same number of cars, and only one of them jams.
For a device that can use 5 GHz, moving up a band is a change no faster line can stand in for. 9.2% of homes have everyday devices, not smart-home sensors, that spend most of their time on 2.4 GHz. The unattended share matters too: congestion that meets nobody tonight is still there for tomorrow's video call.
What does the data say?
Wi-Fi 7 connections moved from 0.57% to 1.14% over six months, measured on the same networks from the first week to the last.

What follows from it?
Roughly a doubling, and still about one connection in ninety. Wi-Fi 7 certification opened in January 2024, and the release that announced it forecast 2.1 billion Wi-Fi 7 devices in the market by 2028 (Wi-Fi Alliance). A live population shows what the middle of such a curve looks like: six months of growth, from almost nothing to very little.
Its best-known feature, multi-link operation, spreads one device's traffic across two or more radio links at once. That helps a well-covered home use its bands better. Two links from the same spot still put no signal into a room that had none, and they do not replace a missing or misplaced mesh node. About 1.0% of connections here come from devices able to use it.
Standards arrive on a date. Installed bases change one replaced device at a time: a phone every few years, a television rarely, a printer when it stops working, and a gateway when someone decides to replace it.
The data did not show a fleet getting worse. Wi-Fi 6 holds a quarter of connections, and Wi-Fi 7 doubled its share in six months.
It did not show a shortcut either. No firmware release, router swap or new standard fixes this on its own. A device gets the lowest of six ceilings: its own generation, the gateway, the band, the channel width, the walls and the neighbours. Raising one while another binds changes nothing the household notices.
Those six are not equally fixed. Device generation sits with the household and changes over years. The other five sit closer to the network. The gateway is a replacement decision, the band a steering decision, the width a configuration decision that differs from home to home, and coverage and congestion are placement and channel decisions. Even the wire before the radio can bind: the cable between the fibre terminal and the gateway, if it is rated for 100 Mbps, caps a gigabit line before any Wi-Fi is involved.
One last measurement shows the headroom. It takes the most capable gateway model in the measured networks and the speed each of its clients could actually get, on every band.

The estimate starts from the link rate the radio agrees with the device, then accounts for how much airtime the channel leaves free, so it lands close to what a speed test would show. Even on this gateway, clients reach an estimated 1000 Mbps or more only about 5.5% of the time. If that is the top of the range, a gigabit over Wi-Fi is still the exception rather than the rule. Any operator weighing a multi-gigabit tier might ask how many homes would notice the difference.
Knowing which ceiling binds in which home, down to the homes where a second node would help, takes a daily measurement of every home. That is what Lifemote runs for the operators it works with.
.svg)

.svg)

.svg)
.svg)

.svg)
.svg)
.svg)
.svg)




.svg)
.svg)


